bundles / scipy latest / scipy / spatial / _plotutils / voronoi_plot_2d
function
scipy.spatial._plotutils:voronoi_plot_2d
Signature
def voronoi_plot_2d ( vor , ax = None , ** kw ) Summary
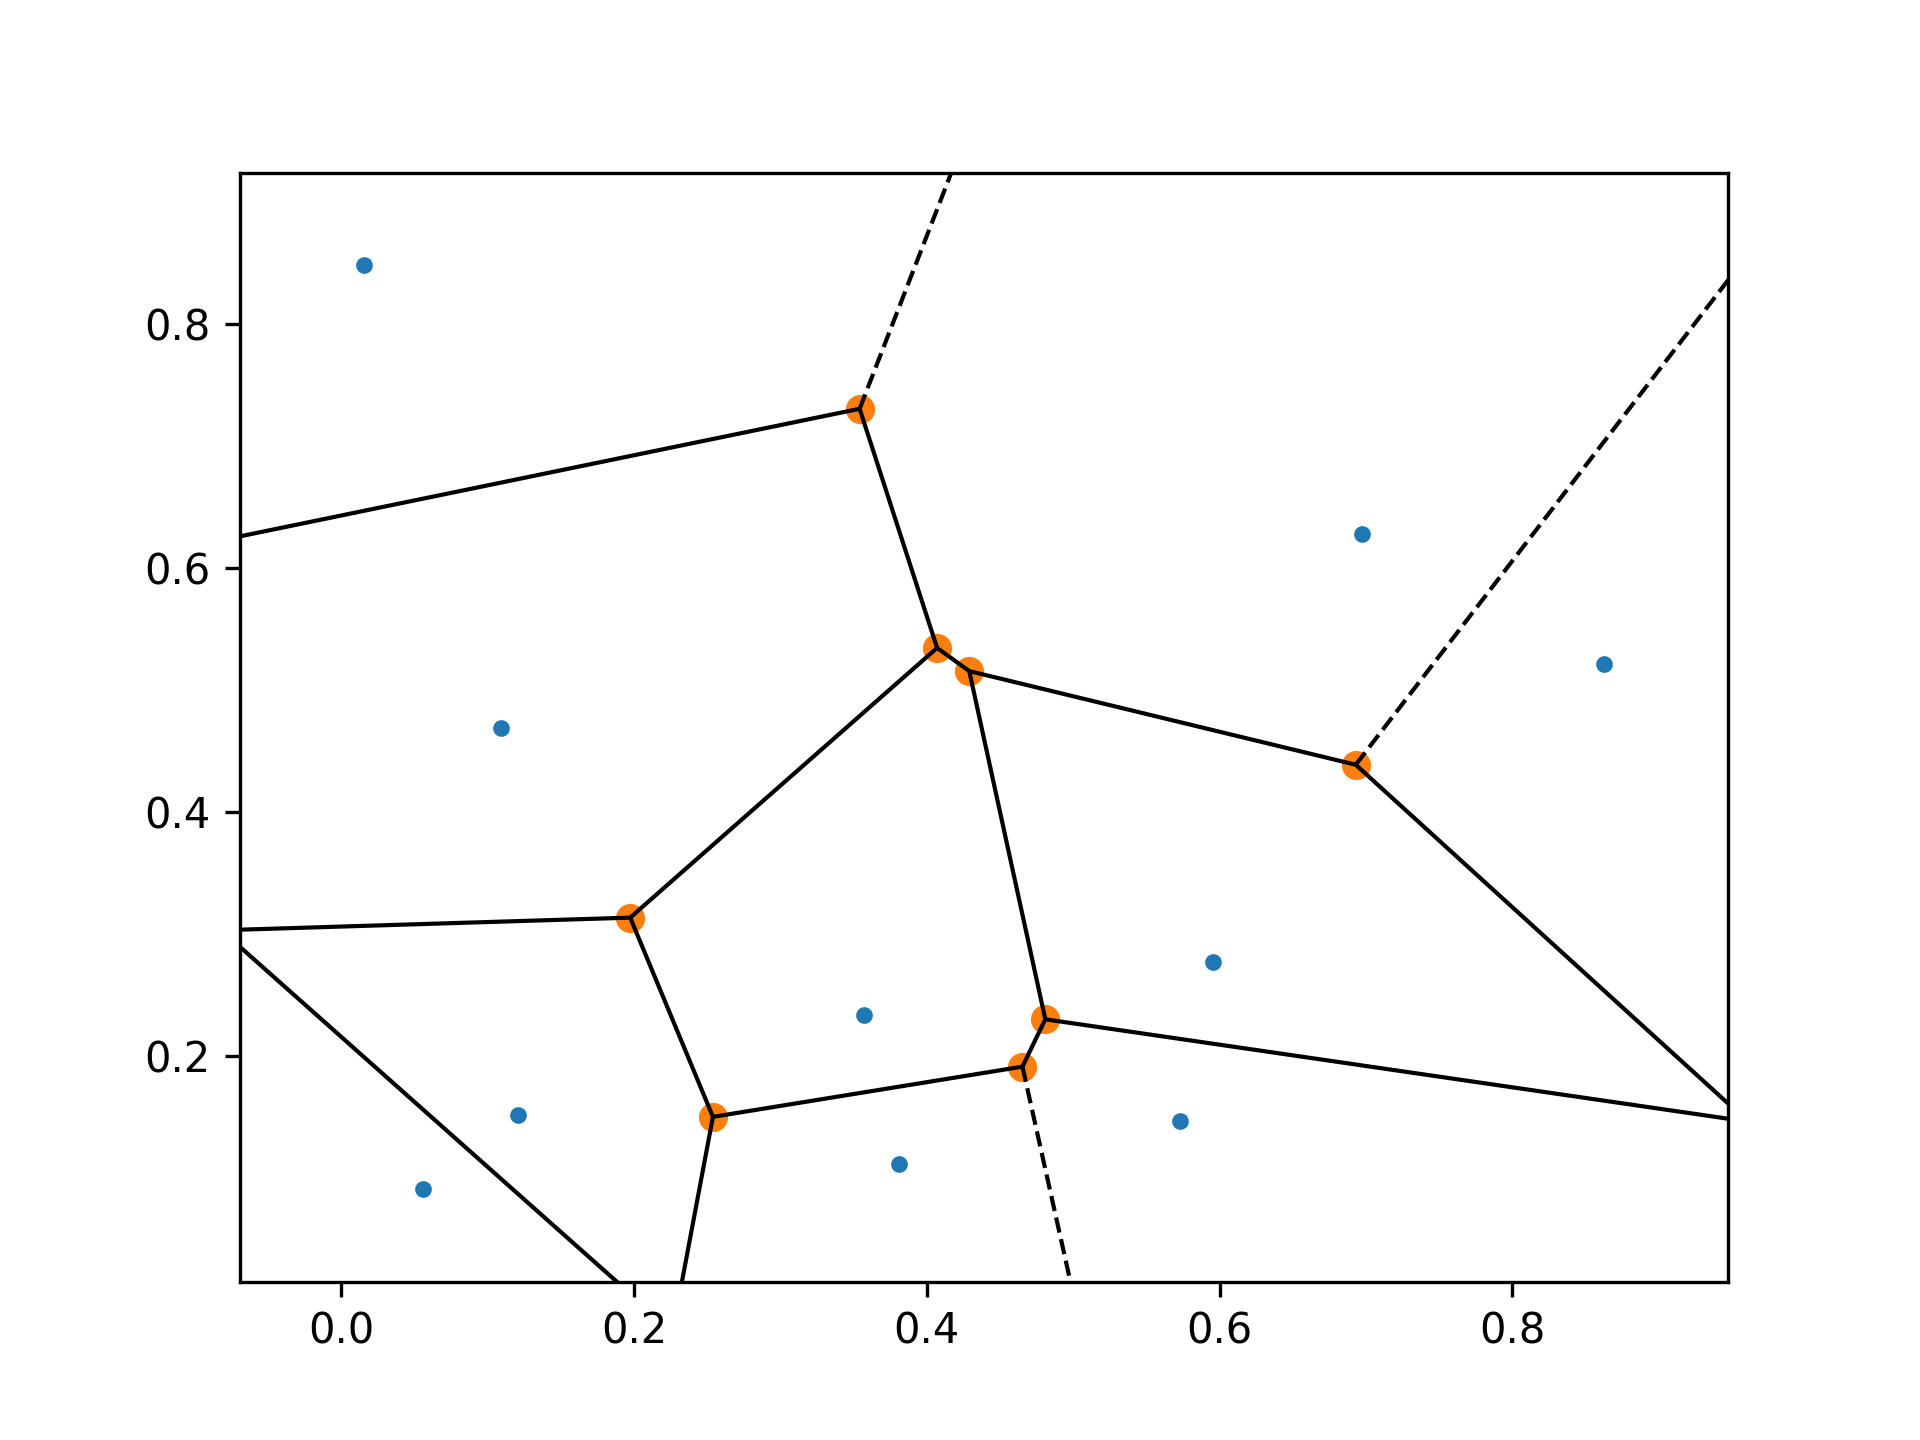
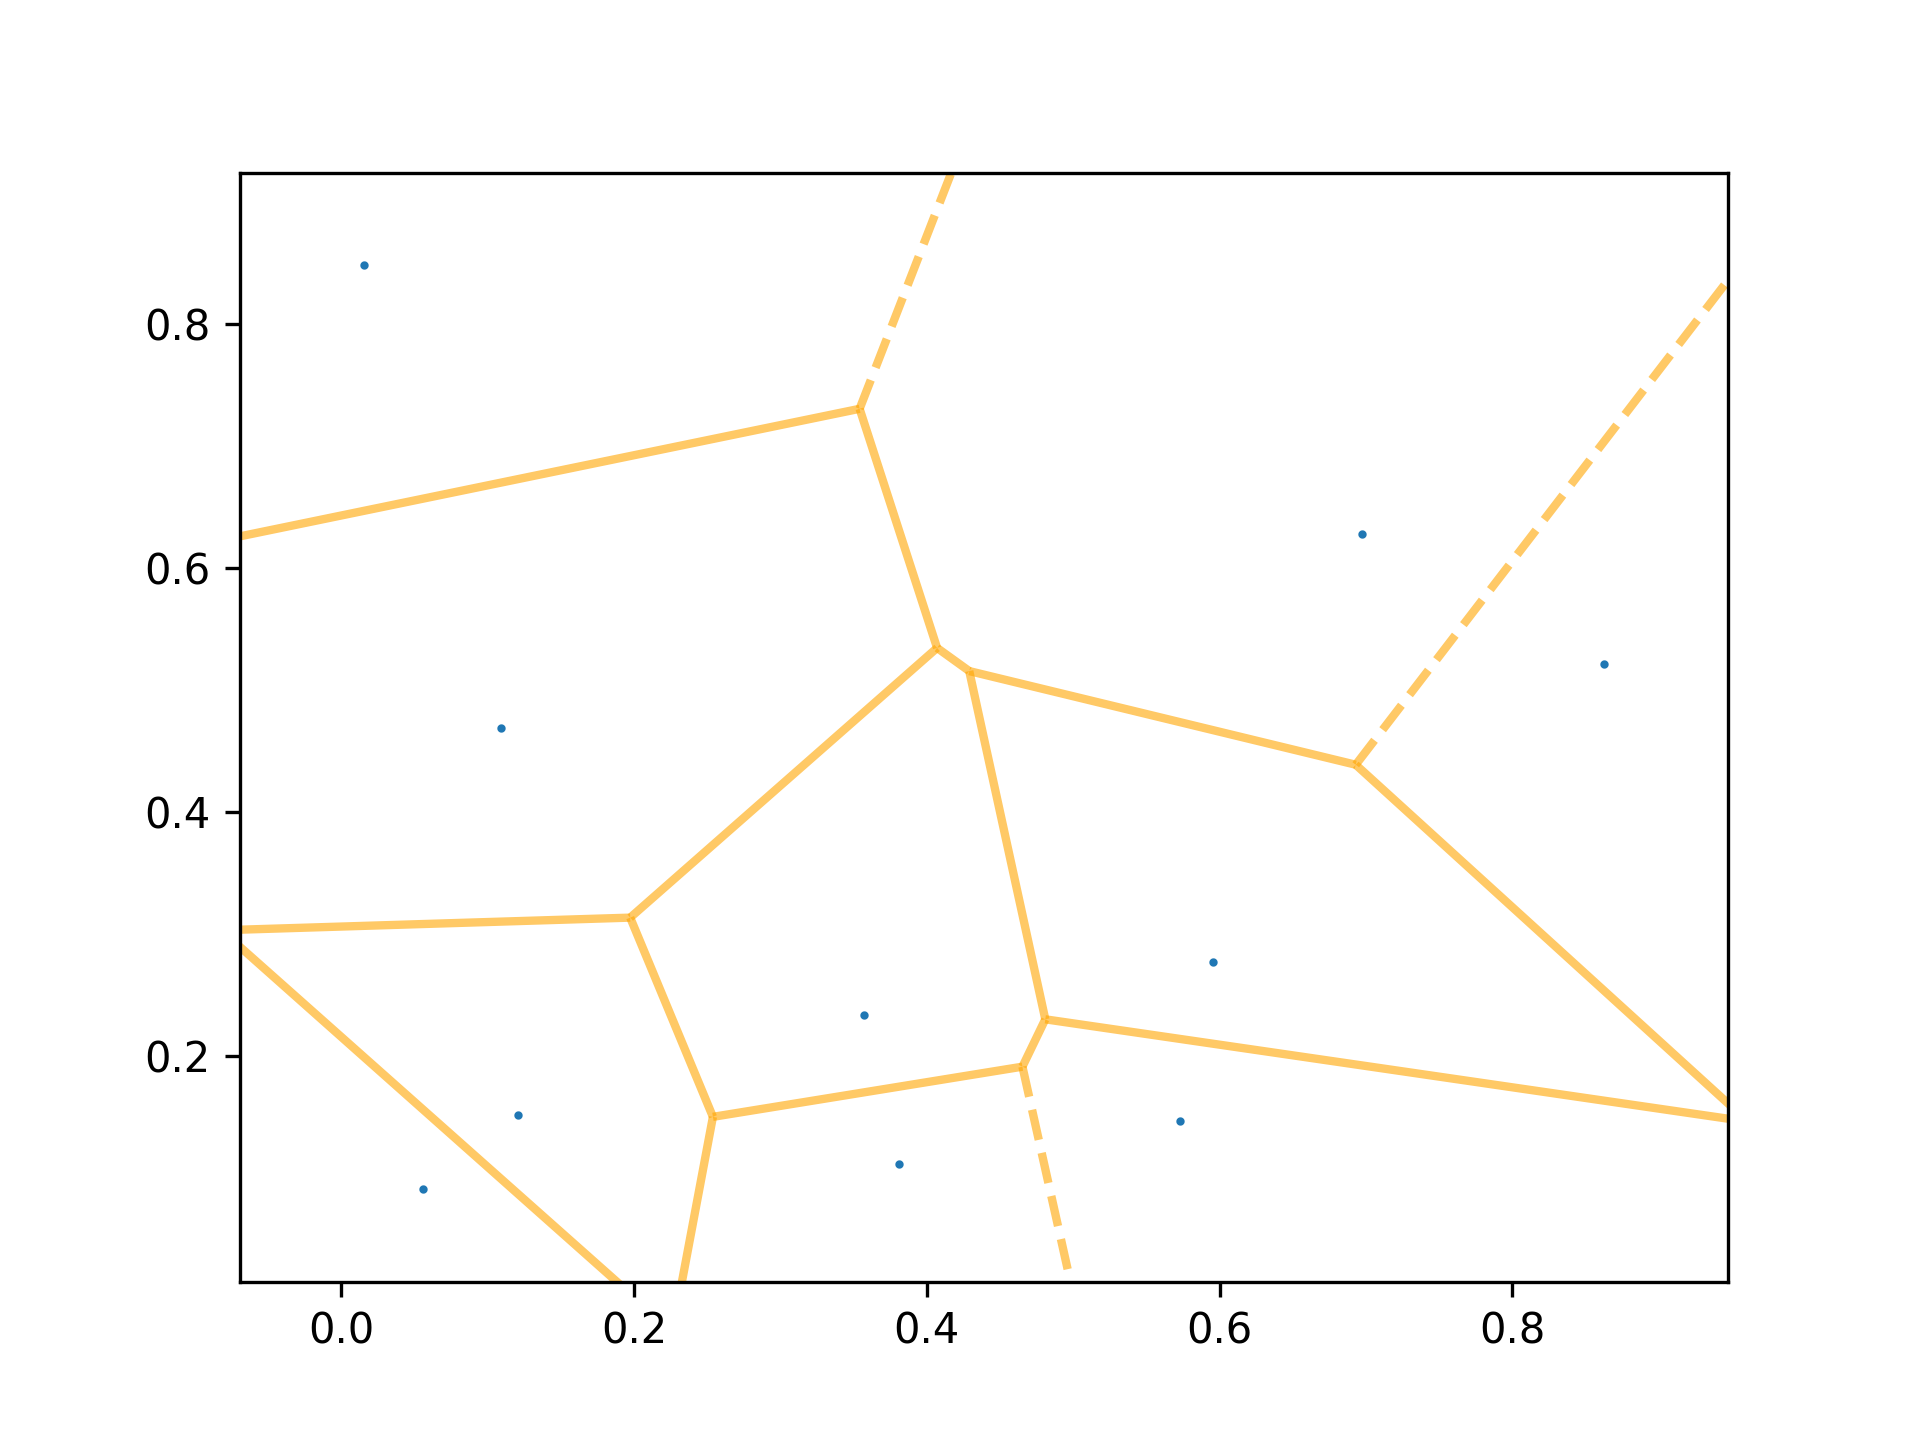
Plot the given Voronoi diagram in 2-D
Parameters
vor: scipy.spatial.Voronoi instanceDiagram to plot
ax: matplotlib.axes.Axes instance, optionalAxes to plot on
show_points: bool, optionalAdd the Voronoi points to the plot.
show_vertices: bool, optionalAdd the Voronoi vertices to the plot.
line_colors: string, optionalSpecifies the line color for polygon boundaries
line_width: float, optionalSpecifies the line width for polygon boundaries
line_alpha: float, optionalSpecifies the line alpha for polygon boundaries
point_size: float, optionalSpecifies the size of points
Returns
fig: matplotlib.figure.Figure instanceFigure for the plot
Notes
Requires Matplotlib. For degenerate input, including collinearity and other violations of general position, it may be preferable to calculate the Voronoi diagram with Qhull options QJ for random joggling, or Qt to enforce triangulated output. Otherwise, some Voronoi regions may not be visible.
Examples
import numpy as np
import matplotlib.pyplot as plt
from scipy.spatial import Voronoi, voronoi_plot_2d
✓
rng = np.random.default_rng()
points = rng.random((10,2))
✓
vor = Voronoi(points)
✓fig = voronoi_plot_2d(vor)
✓fig = voronoi_plot_2d(vor, show_vertices=False, line_colors='orange', line_width=2, line_alpha=0.6, point_size=2) plt.show()✓
See also
Aliases
-
scipy.spatial.voronoi_plot_2d