bundles / numpy 2.4.3 / numpy / random / RandomState / noncentral_f
cython_function_or_method
numpy.random:RandomState.noncentral_f
Signature
def noncentral_f ( dfnum , dfden , nonc , size = None ) Summary
Draw samples from the noncentral F distribution.
Extended Summary
Samples are drawn from an F distribution with specified parameters, dfnum (degrees of freedom in numerator) and dfden (degrees of freedom in denominator), where both parameters > 1. nonc is the non-centrality parameter.
Parameters
dfnum: float or array_like of floatsNumerator degrees of freedom, must be > 0.
dfden: float or array_like of floatsDenominator degrees of freedom, must be > 0.
nonc: float or array_like of floatsNon-centrality parameter, the sum of the squares of the numerator means, must be >= 0.
size: int or tuple of ints, optionalOutput shape. If the given shape is, e.g.,
(m, n, k), thenm * n * ksamples are drawn. If size isNone(default), a single value is returned ifdfnum,dfden, andnoncare all scalars. Otherwise,np.broadcast(dfnum, dfden, nonc).sizesamples are drawn.
Returns
out: ndarray or scalarDrawn samples from the parameterized noncentral Fisher distribution.
Notes
When calculating the power of an experiment (power = probability of rejecting the null hypothesis when a specific alternative is true) the non-central F statistic becomes important. When the null hypothesis is true, the F statistic follows a central F distribution. When the null hypothesis is not true, then it follows a non-central F statistic.
Examples
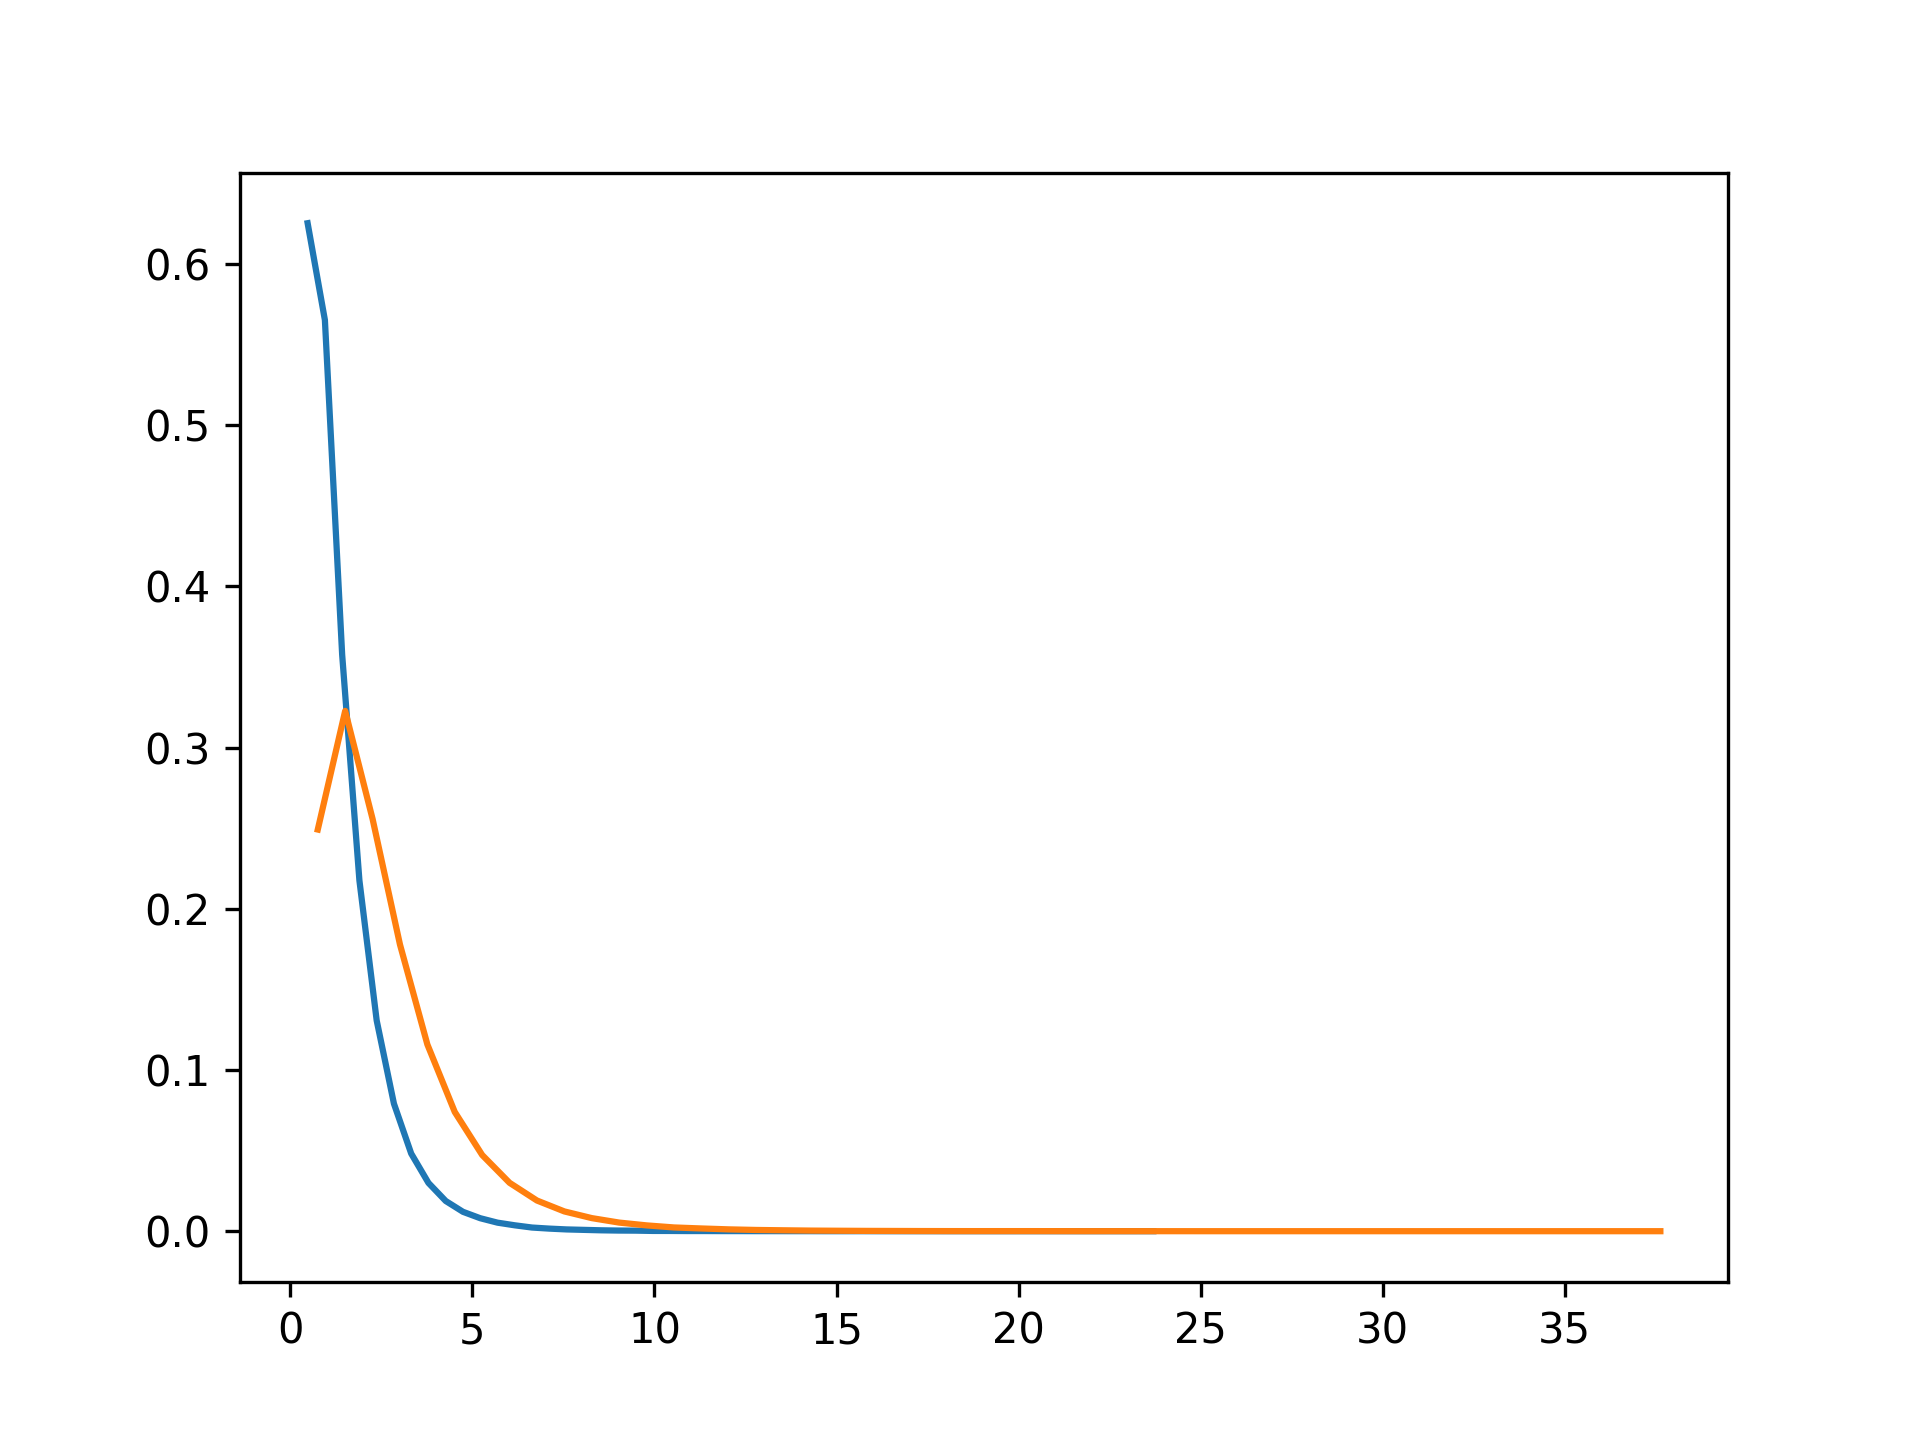
In a study, testing for a specific alternative to the null hypothesis requires use of the Noncentral F distribution. We need to calculate the area in the tail of the distribution that exceeds the value of the F distribution for the null hypothesis. We'll plot the two probability distributions for comparison.dfnum = 3 # between group deg of freedom dfden = 20 # within groups degrees of freedom nonc = 3.0 nc_vals = np.random.noncentral_f(dfnum, dfden, nonc, 1000000) NF = np.histogram(nc_vals, bins=50, density=True) c_vals = np.random.f(dfnum, dfden, 1000000) F = np.histogram(c_vals, bins=50, density=True) import matplotlib.pyplot as plt✓
plt.plot(F[1][1:], F[0])
plt.plot(NF[1][1:], NF[0])
✗
plt.show()
✓
See also
- random.Generator.noncentral_f
which should be used for new code.
Aliases
-
numpy.random.noncentral_f -
numpy.random.RandomState.noncentral_f