bundles / numpy 2.4.3 / numpy / random / RandomState / power
cython_function_or_method
numpy.random:RandomState.power
Signature
def power ( a , size = None ) Summary
Draws samples in [0, 1] from a power distribution with positive exponent a - 1.
Extended Summary
Also known as the power function distribution.
Parameters
a: float or array_like of floatsParameter of the distribution. Must be non-negative.
size: int or tuple of ints, optionalOutput shape. If the given shape is, e.g.,
(m, n, k), thenm * n * ksamples are drawn. If size isNone(default), a single value is returned ifais a scalar. Otherwise,np.array(a).sizesamples are drawn.
Returns
out: ndarray or scalarDrawn samples from the parameterized power distribution.
Raises
: ValueErrorIf a <= 0.
Notes
The probability density function is
The power function distribution is just the inverse of the Pareto distribution. It may also be seen as a special case of the Beta distribution.
It is used, for example, in modeling the over-reporting of insurance claims.
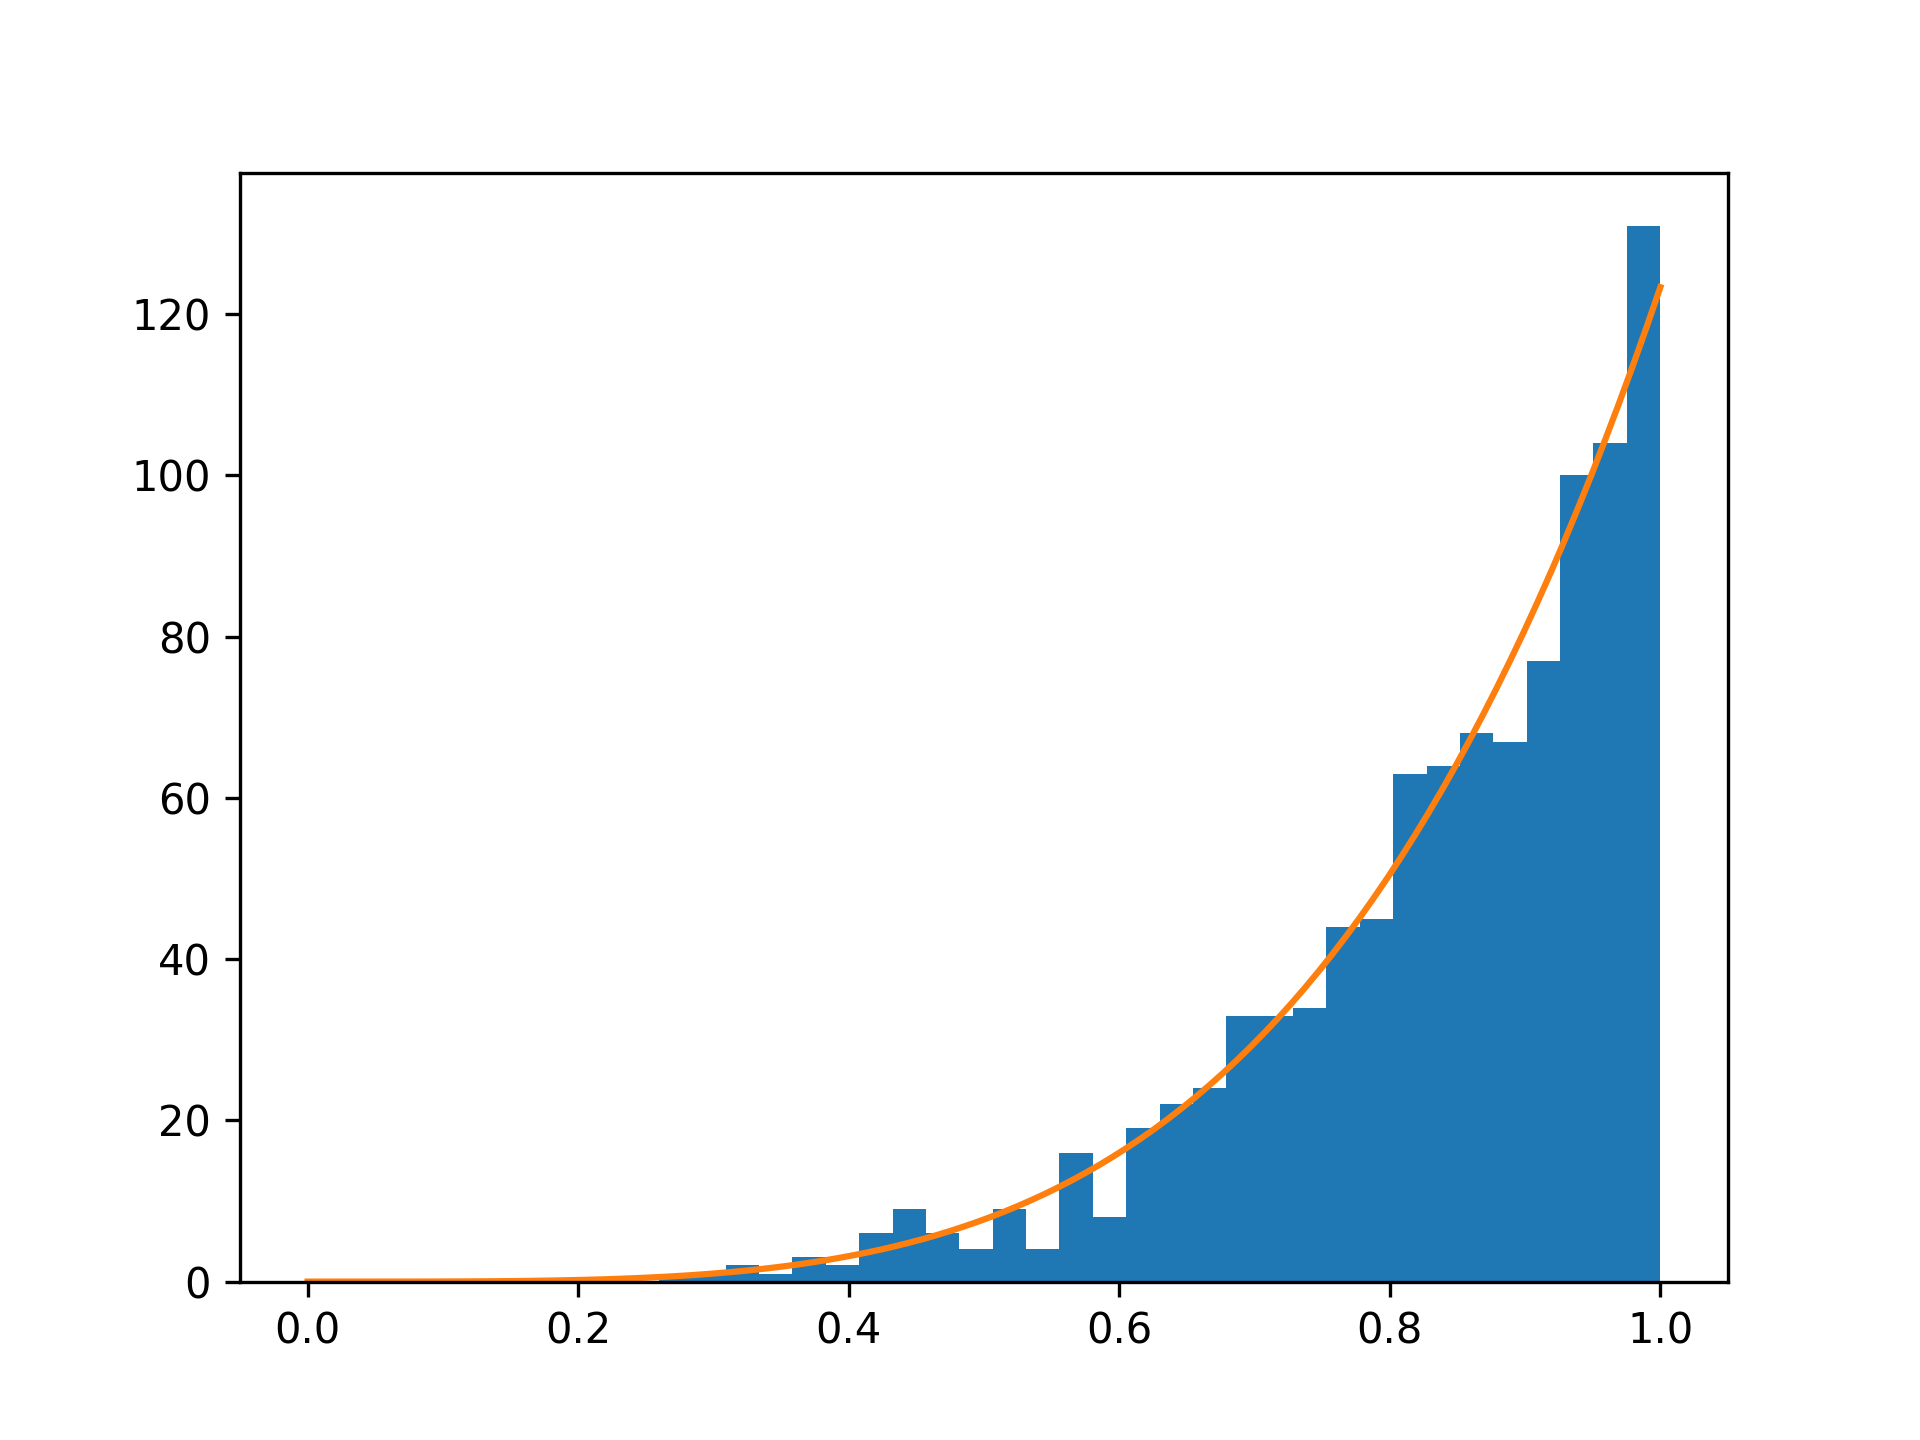
Examples
Draw samples from the distribution:a = 5. # shape samples = 1000 s = np.random.power(a, samples)✓
import matplotlib.pyplot as plt
count, bins, ignored = plt.hist(s, bins=30)
x = np.linspace(0, 1, 100)
y = a*x**(a-1.)
normed_y = samples*np.diff(bins)[0]*y
✓
plt.plot(x, normed_y)
✗plt.show()
✓
rvs = np.random.power(5, 1000000)
rvsp = np.random.pareto(5, 1000000)
xx = np.linspace(0,1,100)
✓
plt.figure()
plt.hist(rvs, bins=50, density=True)
plt.title('np.random.power(5)')
✗
plt.figure()
plt.hist(1./(1.+rvsp), bins=50, density=True)
plt.title('inverse of 1 + np.random.pareto(5)')
✗
plt.figure()
plt.hist(1./(1.+rvsp), bins=50, density=True)
plt.title('inverse of stats.pareto(5)')
✗
See also
- random.Generator.power
which should be used for new code.
Aliases
-
numpy.random.power -
numpy.random.RandomState.power