bundles / numpy 2.4.3 / numpy / random / _generator / Generator / beta
cython_function_or_method
numpy.random._generator:Generator.beta
Signature
def beta ( a , b , size = None ) Summary
Draw samples from a Beta distribution.
Extended Summary
The Beta distribution is a special case of the Dirichlet distribution, and is related to the Gamma distribution. It has the probability distribution function
where the normalization, B, is the beta function,
It is often seen in Bayesian inference and order statistics.
Parameters
a: float or array_like of floatsAlpha, positive (>0).
b: float or array_like of floatsBeta, positive (>0).
size: int or tuple of ints, optionalOutput shape. If the given shape is, e.g.,
(m, n, k), thenm * n * ksamples are drawn. If size isNone(default), a single value is returned ifaandbare both scalars. Otherwise,np.broadcast(a, b).sizesamples are drawn.
Returns
out: ndarray or scalarDrawn samples from the parameterized beta distribution.
Examples
The beta distribution has mean a/(a+b). If ``a == b`` and both are > 1, the distribution is symmetric with mean 0.5.rng = np.random.default_rng() a, b, size = 2.0, 2.0, 10000 sample = rng.beta(a=a, b=b, size=size)✓
np.mean(sample)
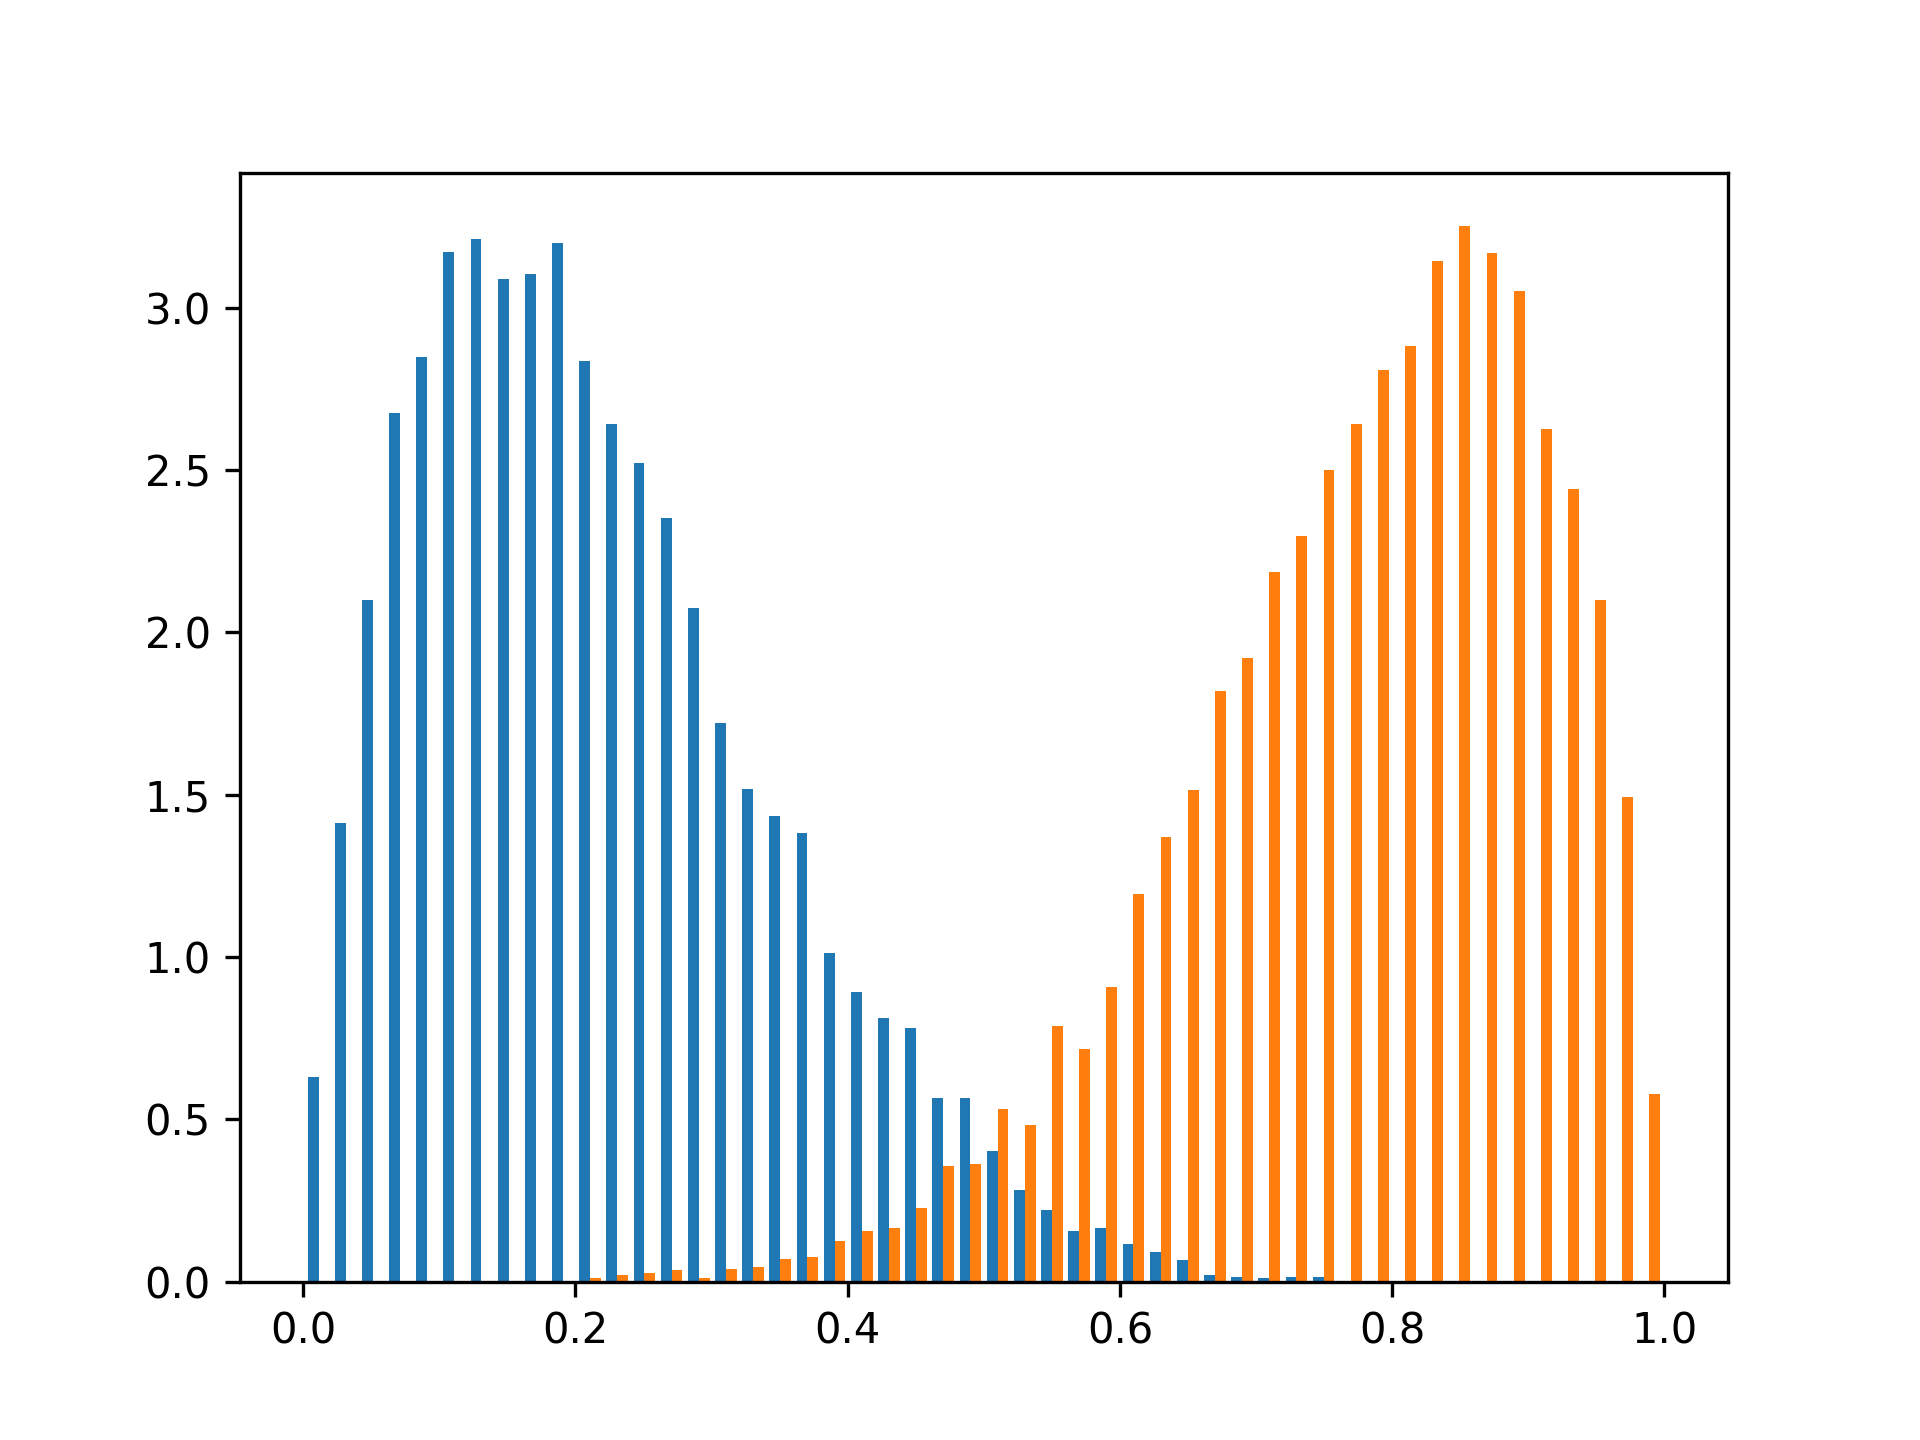
✗a, b, size = 2, 7, 10000 sample_left = rng.beta(a=a, b=b, size=size) sample_right = rng.beta(a=b, b=a, size=size) m_left, m_right = np.mean(sample_left), np.mean(sample_right)✓
print(m_left, m_right)
print(m_left - a/(a+b))
print(m_right - b/(a+b))
✗
import matplotlib.pyplot as plt
✓plt.hist([sample_left, sample_right], 50, density=True, histtype='bar')✗
plt.show()
✓
Aliases
-
numpy.random.Generator.beta