bundles / numpy 2.4.3 / numpy / random / _generator / Generator / logistic
cython_function_or_method
numpy.random._generator:Generator.logistic
Signature
def logistic ( loc = 0.0 , scale = 1.0 , size = None ) Summary
Draw samples from a logistic distribution.
Extended Summary
Samples are drawn from a logistic distribution with specified parameters, loc (location or mean, also median), and scale (>0).
Parameters
loc: float or array_like of floats, optionalParameter of the distribution. Default is 0.
scale: float or array_like of floats, optionalParameter of the distribution. Must be non-negative. Default is 1.
size: int or tuple of ints, optionalOutput shape. If the given shape is, e.g.,
(m, n, k), thenm * n * ksamples are drawn. If size isNone(default), a single value is returned iflocandscaleare both scalars. Otherwise,np.broadcast(loc, scale).sizesamples are drawn.
Returns
out: ndarray or scalarDrawn samples from the parameterized logistic distribution.
Notes
The probability density for the Logistic distribution is
where = location and = scale.
The Logistic distribution is used in Extreme Value problems where it can act as a mixture of Gumbel distributions, in Epidemiology, and by the World Chess Federation (FIDE) where it is used in the Elo ranking system, assuming the performance of each player is a logistically distributed random variable.
Examples
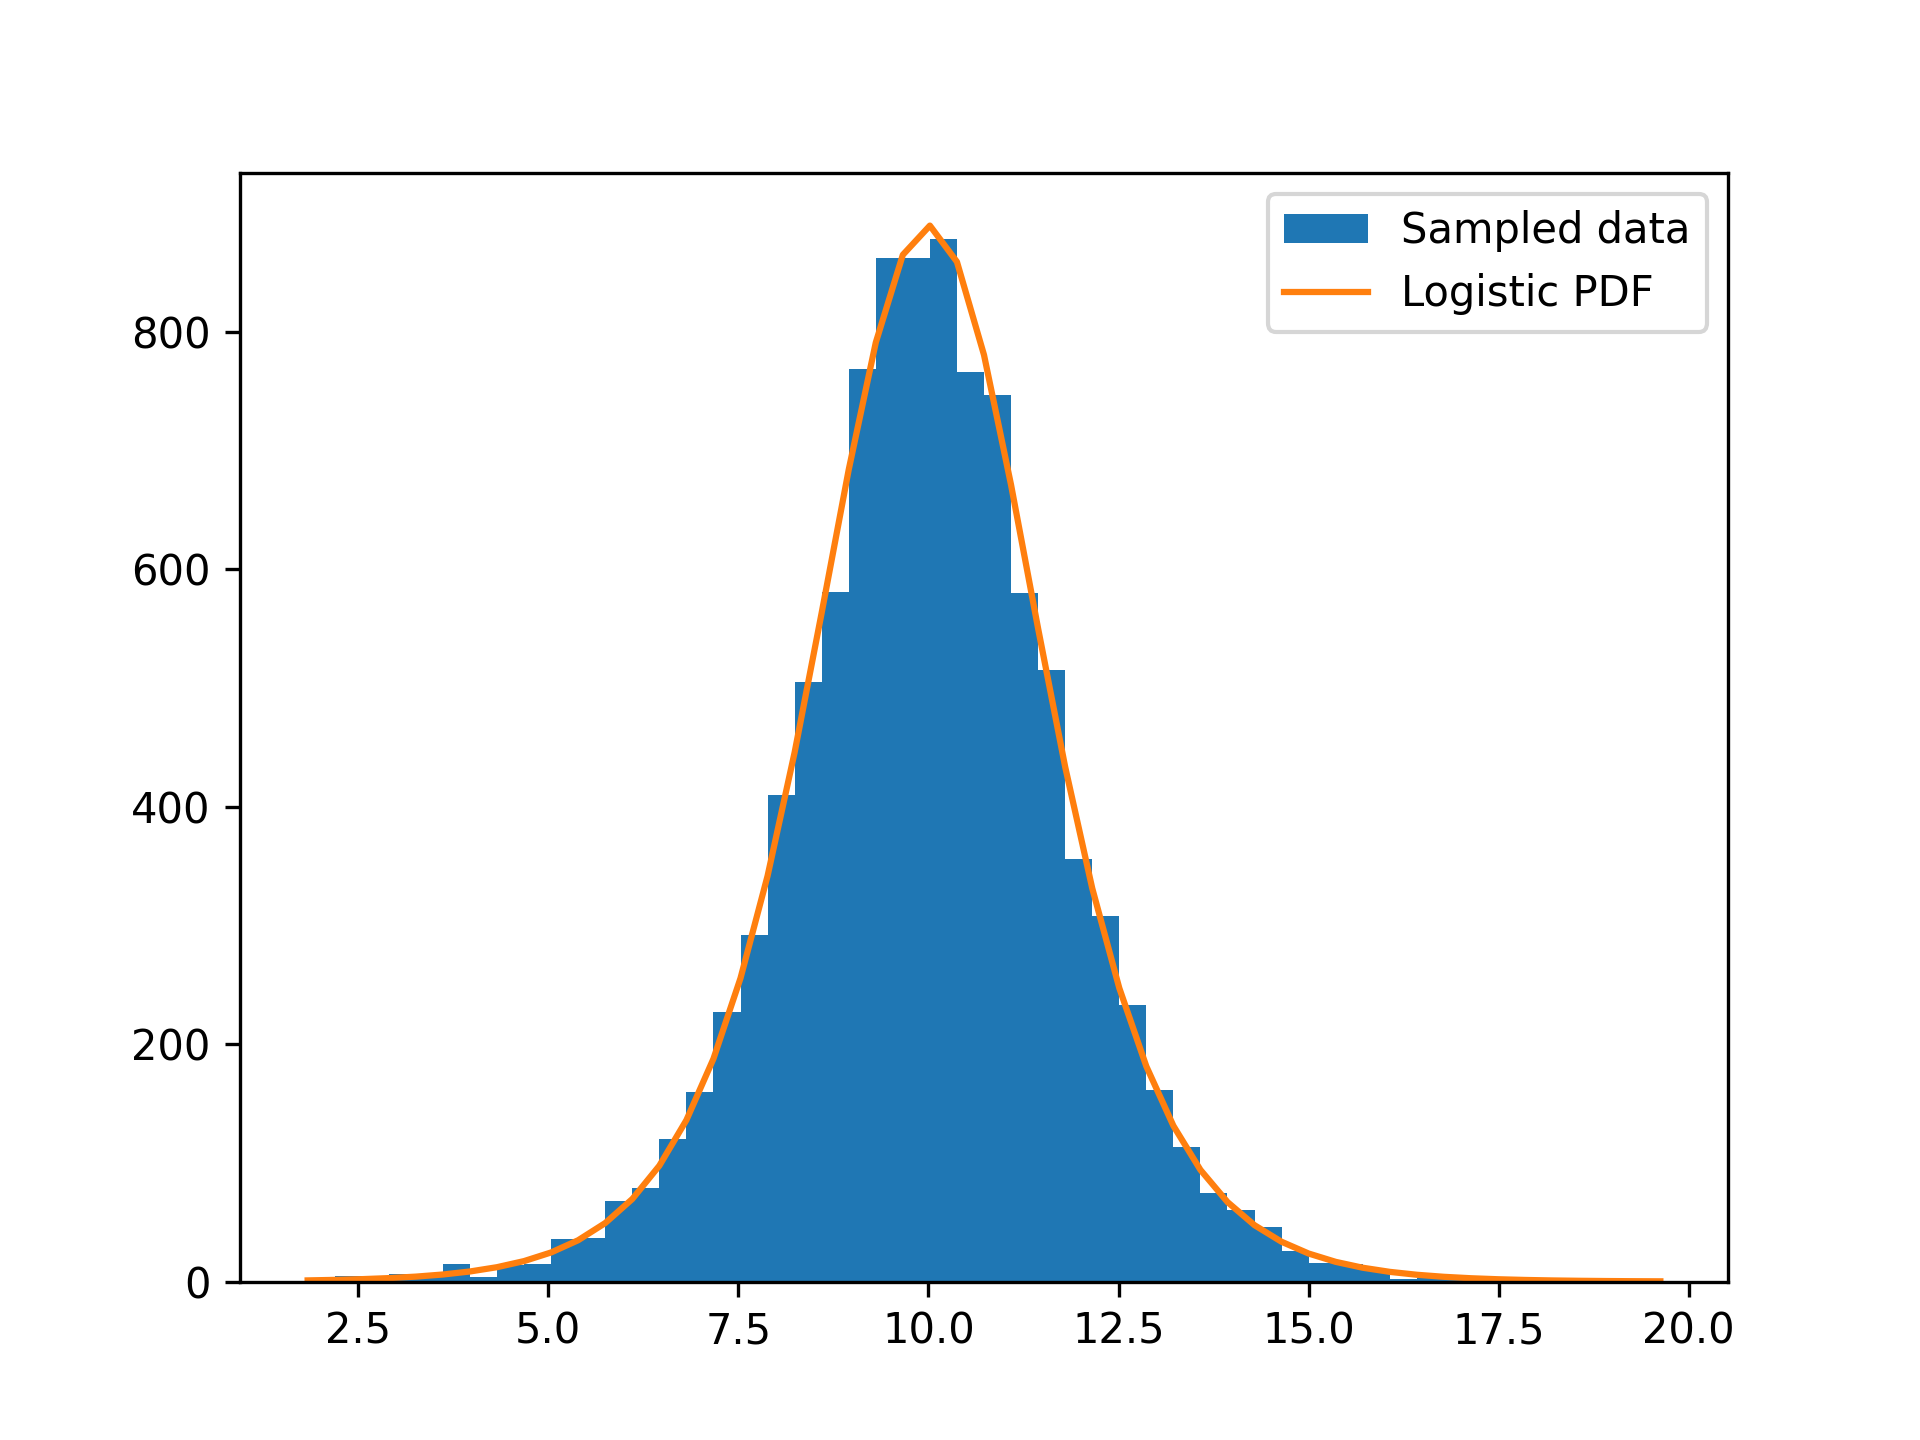
Draw samples from the distribution:loc, scale = 10, 1 rng = np.random.default_rng() s = rng.logistic(loc, scale, 10000) import matplotlib.pyplot as plt count, bins, _ = plt.hist(s, bins=50, label='Sampled data')✓
def logistic(x, loc, scale):
    return np.exp((loc-x)/scale)/(scale*(1+np.exp((loc-x)/scale))**2)
logistic_values  = logistic(bins, loc, scale)
bin_spacing = np.mean(np.diff(bins))
✓
plt.plot(bins, logistic_values  * bin_spacing * s.size, label='Logistic PDF')
plt.legend()
✗
plt.show()
✓
See also
- scipy.stats.logistic
probability density function, distribution or cumulative density function, etc.
Aliases
-
numpy.random.Generator.logistic