bundles / numpy 2.5.0.dev0+git20251130.2de293a / numpy / random / _generator / Generator / f
cython_function_or_method
numpy.random._generator:Generator.f
Signature
def f ( dfnum , dfden , size = None ) Summary
Draw samples from an F distribution.
Extended Summary
Samples are drawn from an F distribution with specified parameters, dfnum (degrees of freedom in numerator) and dfden (degrees of freedom in denominator), where both parameters must be greater than zero.
The random variate of the F distribution (also known as the Fisher distribution) is a continuous probability distribution that arises in ANOVA tests, and is the ratio of two chi-square variates.
Parameters
dfnum: float or array_like of floatsDegrees of freedom in numerator, must be > 0.
dfden: float or array_like of floatDegrees of freedom in denominator, must be > 0.
size: int or tuple of ints, optionalOutput shape. If the given shape is, e.g.,
(m, n, k), thenm * n * ksamples are drawn. If size isNone(default), a single value is returned ifdfnumanddfdenare both scalars. Otherwise,np.broadcast(dfnum, dfden).sizesamples are drawn.
Returns
out: ndarray or scalarDrawn samples from the parameterized Fisher distribution.
Notes
The F statistic is used to compare in-group variances to between-group variances. Calculating the distribution depends on the sampling, and so it is a function of the respective degrees of freedom in the problem. The variable dfnum is the number of samples minus one, the between-groups degrees of freedom, while dfden is the within-groups degrees of freedom, the sum of the number of samples in each group minus the number of groups.
Examples
An example from Glantz [1]_, pp 47-40: Two groups, children of diabetics (25 people) and children from people without diabetes (25 controls). Fasting blood glucose was measured, case group had a mean value of 86.1, controls had a mean value of 82.2. Standard deviations were 2.09 and 2.49 respectively. Are these data consistent with the null hypothesis that the parents diabetic status does not affect their children's blood glucose levels? Calculating the F statistic from the data gives a value of 36.01. Draw samples from the distribution:dfnum = 1. # between group degrees of freedom dfden = 48. # within groups degrees of freedom rng = np.random.default_rng() s = rng.f(dfnum, dfden, 1000)✓
np.sort(s)[-10]
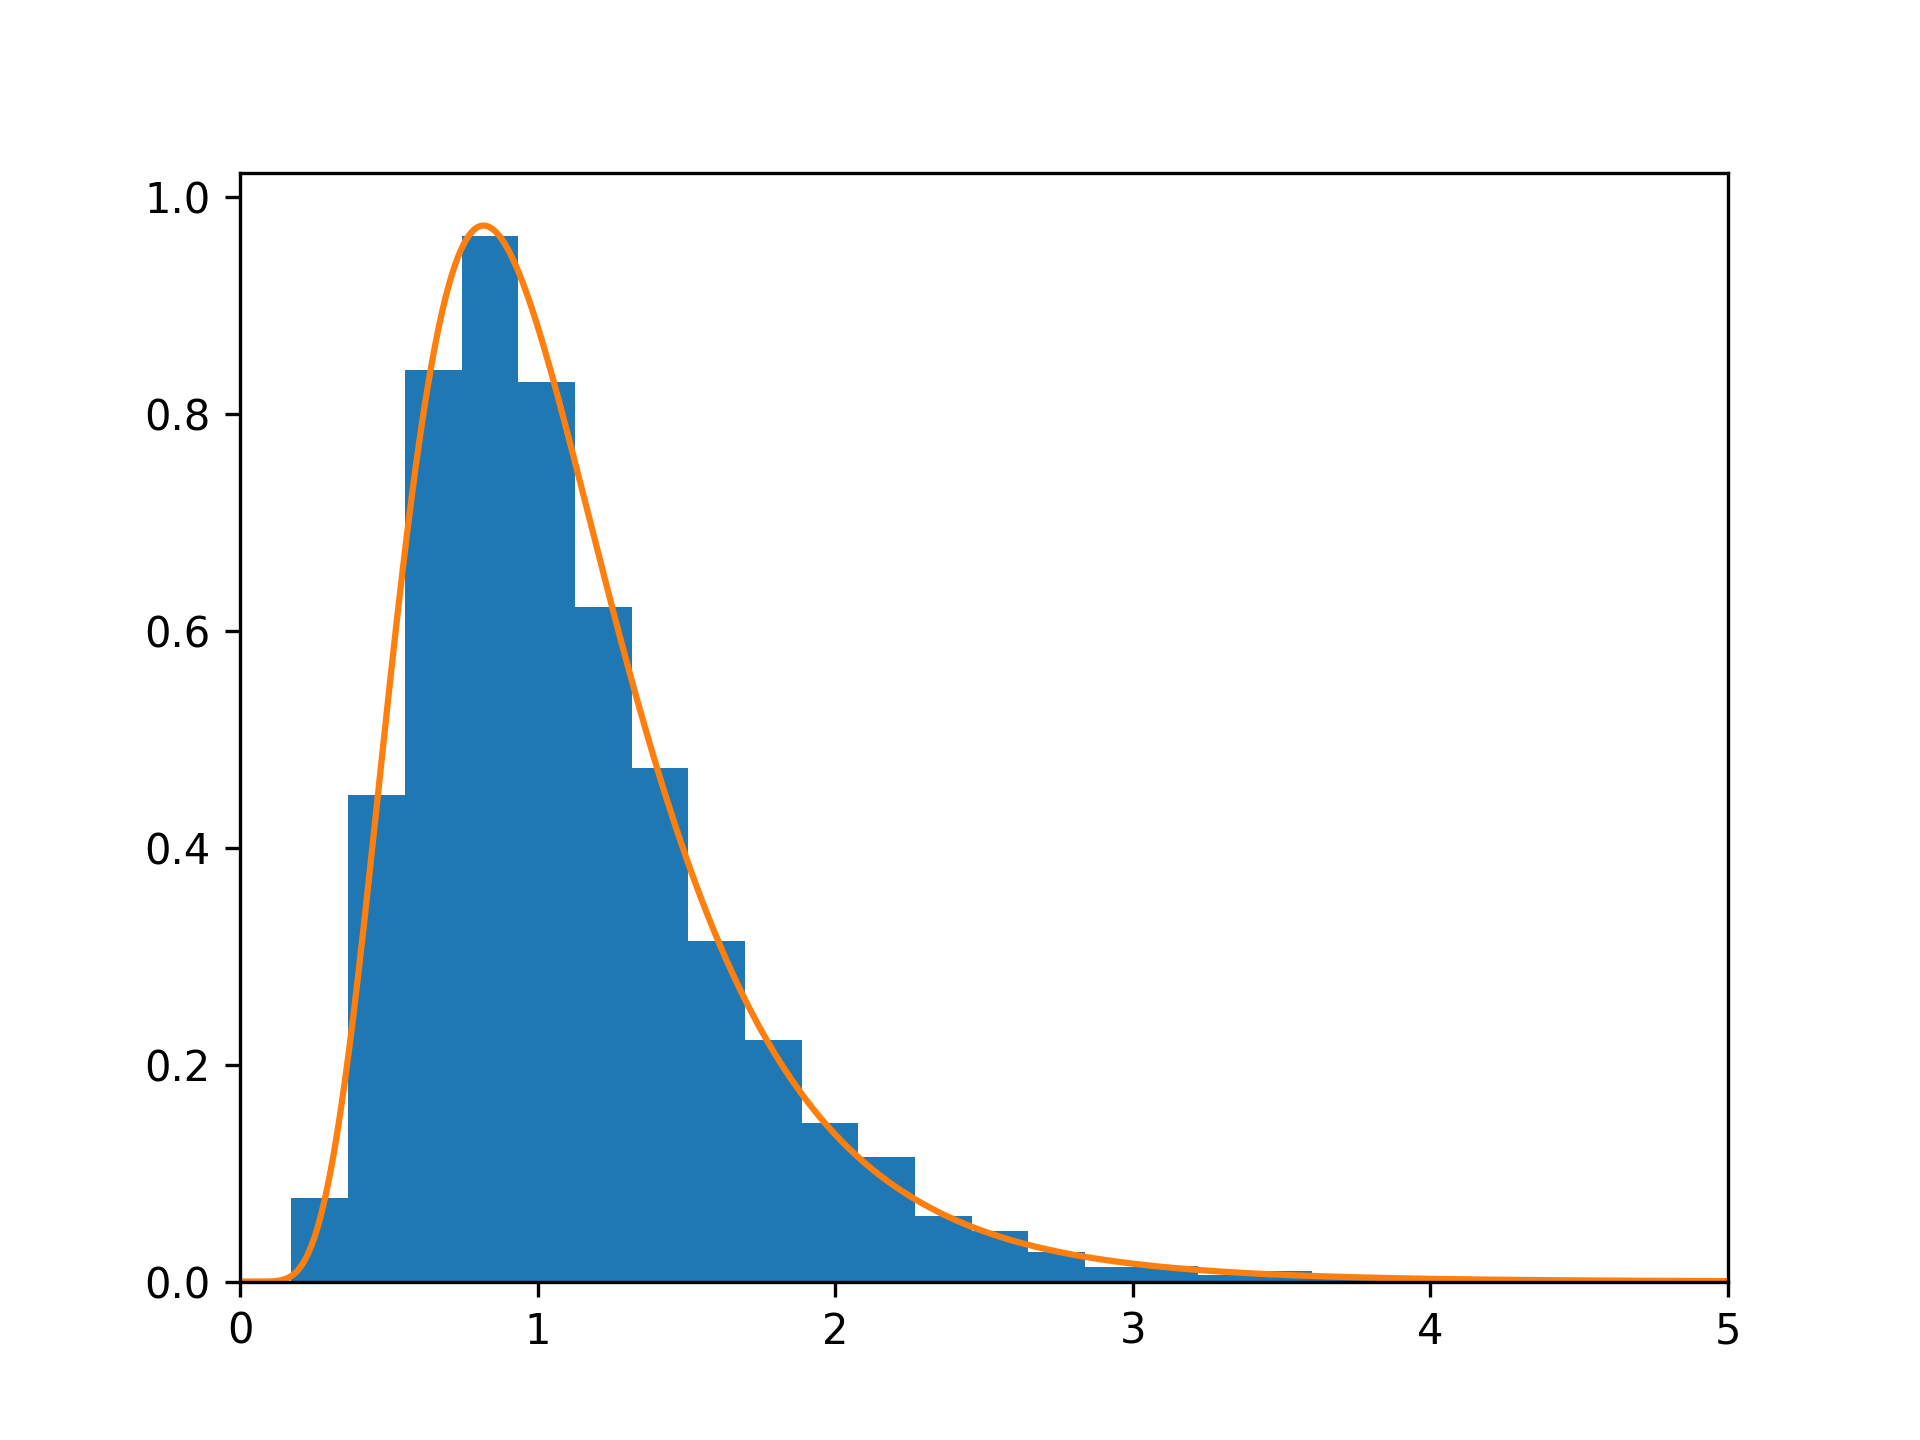
✗import matplotlib.pyplot as plt from scipy import stats dfnum, dfden, size = 20, 20, 10000 s = rng.f(dfnum=dfnum, dfden=dfden, size=size) bins, density, _ = plt.hist(s, 30, density=True) x = np.linspace(0, 5, 1000)✓
plt.plot(x, stats.f.pdf(x, dfnum, dfden))
plt.xlim([0, 5])
✗
plt.show()
✓
See also
- scipy.stats.f
probability density function, distribution or cumulative density function, etc.
Aliases
-
numpy.random.Generator.f