bundles / numpy latest / numpy / interp
_ArrayFunctionDispatcher
numpy:interp
source: /dev/numpy/build-install/usr/lib/python3.14/site-packages/numpy/lib/_function_base_impl.py :1538
Signature
def interp ( x , xp , fp , left = None , right = None , period = None ) Summary
One-dimensional linear interpolation for monotonically increasing sample points.
Extended Summary
Returns the one-dimensional piecewise linear interpolant to a function with given discrete data points (xp, fp), evaluated at x.
Parameters
x: array_likeThe x-coordinates at which to evaluate the interpolated values.
xp: 1-D sequence of floatsThe x-coordinates of the data points, must be increasing if argument
periodis not specified. Otherwise,xpis internally sorted after normalizing the periodic boundaries withxp = xp % period.fp: 1-D sequence of float or complexThe y-coordinates of the data points, same length as
xp.left: optional float or complex corresponding to fpValue to return for
x < xp[0], default isfp[0].right: optional float or complex corresponding to fpValue to return for
x > xp[-1], default isfp[-1].period: None or float, optionalA period for the x-coordinates. This parameter allows the proper interpolation of angular x-coordinates. Parameters
leftandrightare ignored ifperiodis specified.
Returns
y: float or complex (corresponding to fp) or ndarrayThe interpolated values, same shape as
x.
Raises
: ValueErrorIf
xpandfphave different length Ifxporfpare not 1-D sequences Ifperiod == 0
Warnings
The x-coordinate sequence is expected to be increasing, but this is not explicitly enforced. However, if the sequence xp is non-increasing, interpolation results are meaningless.
Note that, since NaN is unsortable, xp also cannot contain NaNs.
A simple check for xp being strictly increasing is
np.all(np.diff(xp) > 0)Examples
import numpy as np
xp = [1, 2, 3]
fp = [3, 2, 0]
✓
np.interp(2.5, xp, fp)
✗np.interp([0, 1, 1.5, 2.72, 3.14], xp, fp) UNDEF = -99.0✓
np.interp(3.14, xp, fp, right=UNDEF)
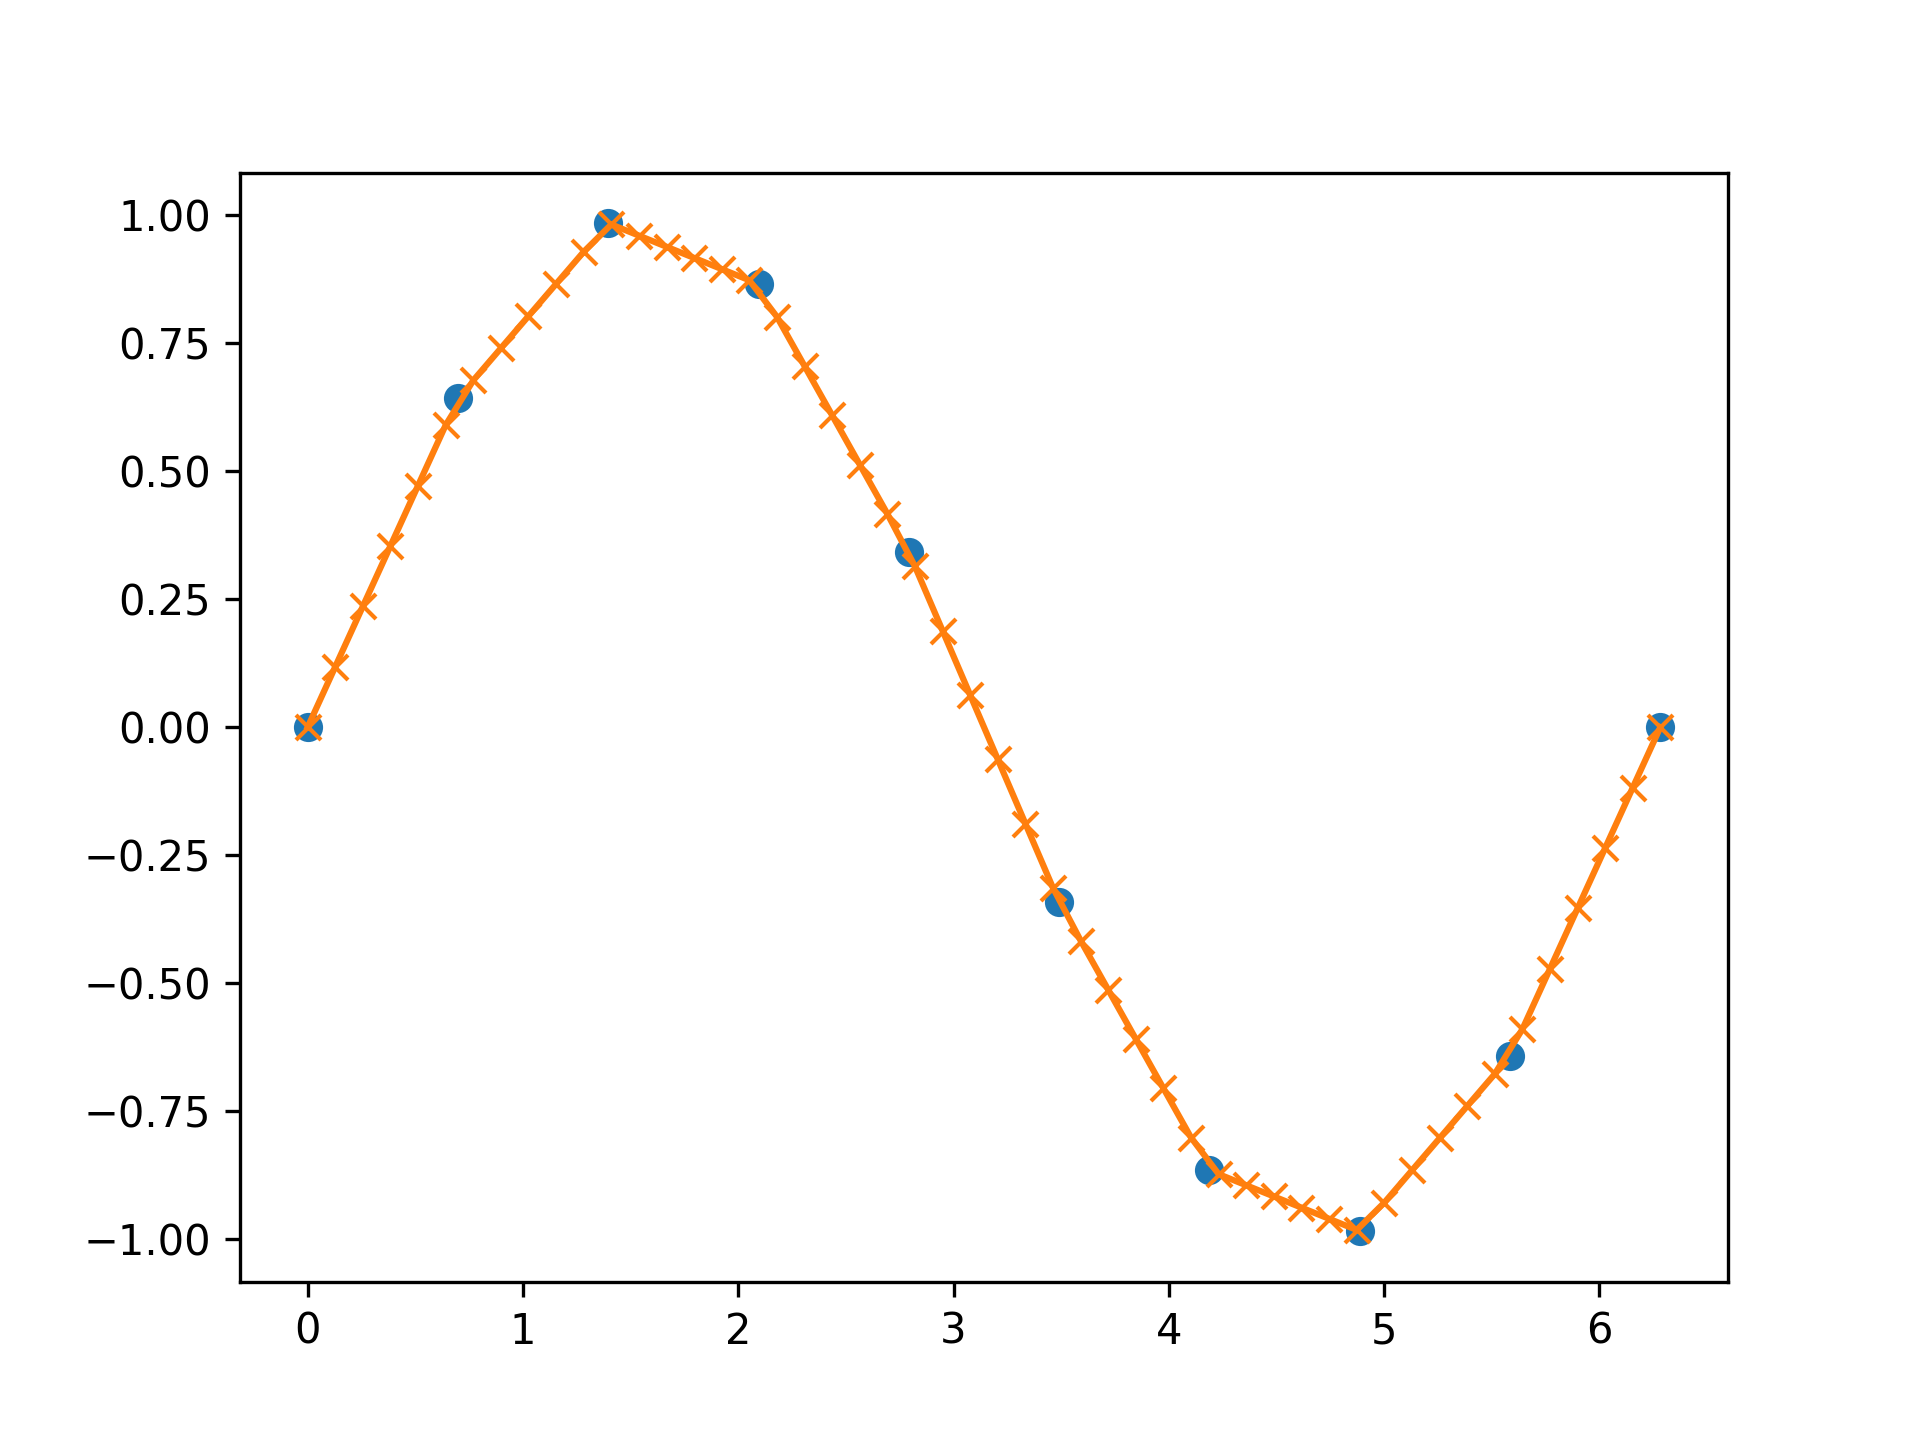
✗x = np.linspace(0, 2*np.pi, 10) y = np.sin(x) xvals = np.linspace(0, 2*np.pi, 50) yinterp = np.interp(xvals, x, y) import matplotlib.pyplot as plt plt.plot(x, y, 'o') plt.plot(xvals, yinterp, '-x') plt.show()✓
x = [-180, -170, -185, 185, -10, -5, 0, 365]
xp = [190, -190, 350, -350]
fp = [5, 10, 3, 4]
np.interp(x, xp, fp, period=360)
✓
x = [1.5, 4.0]
xp = [2,3,5]
fp = [1.0j, 0, 2+3j]
np.interp(x, xp, fp)
✓
See also
- scipy.interpolate
Aliases
-
numpy.interp