bundles / scipy 1.17.1 / scipy / signal / _filter_design / cheby1
function
scipy.signal._filter_design:cheby1
Signature
def cheby1 ( N , rp , Wn , btype = low , analog = False , output = ba , fs = None ) Summary
Chebyshev type I digital and analog filter design.
Extended Summary
Design an Nth-order digital or analog Chebyshev type I filter and return the filter coefficients.
Parameters
N: intThe order of the filter.
rp: floatThe maximum ripple allowed below unity gain in the passband. Specified in decibels, as a positive number.
Wn: array_likeA scalar or length-2 sequence giving the critical frequencies. For Type I filters, this is the point in the transition band at which the gain first drops below -
rp.For digital filters,
Wnare in the same units asfs. By default,fsis 2 half-cycles/sample, so these are normalized from 0 to 1, where 1 is the Nyquist frequency. (Wnis thus in half-cycles / sample.)For analog filters,
Wnis an angular frequency (e.g., rad/s).btype: {'lowpass', 'highpass', 'bandpass', 'bandstop'}, optionalThe type of filter. Default is 'lowpass'.
analog: bool, optionalWhen True, return an analog filter, otherwise a digital filter is returned.
output: {'ba', 'zpk', 'sos'}, optionalType of output: numerator/denominator ('ba'), pole-zero ('zpk'), or second-order sections ('sos'). Default is 'ba' for backwards compatibility, but 'sos' should be used for general-purpose filtering.
fs: float, optionalThe sampling frequency of the digital system.
Returns
b, a: ndarray, ndarrayNumerator (b) and denominator (a) polynomials of the IIR filter. Only returned if
output='ba'.z, p, k: ndarray, ndarray, floatZeros, poles, and system gain of the IIR filter transfer function. Only returned if
output='zpk'.sos: ndarraySecond-order sections representation of the IIR filter. Only returned if
output='sos'.
Notes
The Chebyshev type I filter maximizes the rate of cutoff between the frequency response's passband and stopband, at the expense of ripple in the passband and increased ringing in the step response.
Type I filters roll off faster than Type II (cheby2), but Type II filters do not have any ripple in the passband.
The equiripple passband has N maxima or minima (for example, a 5th-order filter has 3 maxima and 2 minima). Consequently, the DC gain is unity for odd-order filters, or -rp dB for even-order filters.
The 'sos' output parameter was added in 0.16.0.
The current behavior is for ndarray outputs to have 64 bit precision (float64 or complex128) regardless of the dtype of Wn but outputs may respect the dtype of Wn in a future version.
Array API Standard Support
cheby1 has experimental support for Python Array API Standard compatible backends in addition to NumPy. Please consider testing these features by setting an environment variable SCIPY_ARRAY_API=1 and providing CuPy, PyTorch, JAX, or Dask arrays as array arguments. The following combinations of backend and device (or other capability) are supported.
====================  ====================  ====================
Library               CPU                   GPU
====================  ====================  ====================
NumPy                 ✅                     n/a
CuPy                  n/a                   ✅
PyTorch               ✅                     ⛔
JAX                   ⚠️ no JIT             ⛔
Dask                  ⚠️ computes graph     n/a
====================  ====================  ====================
See
dev-arrayapifor more information.
Examples
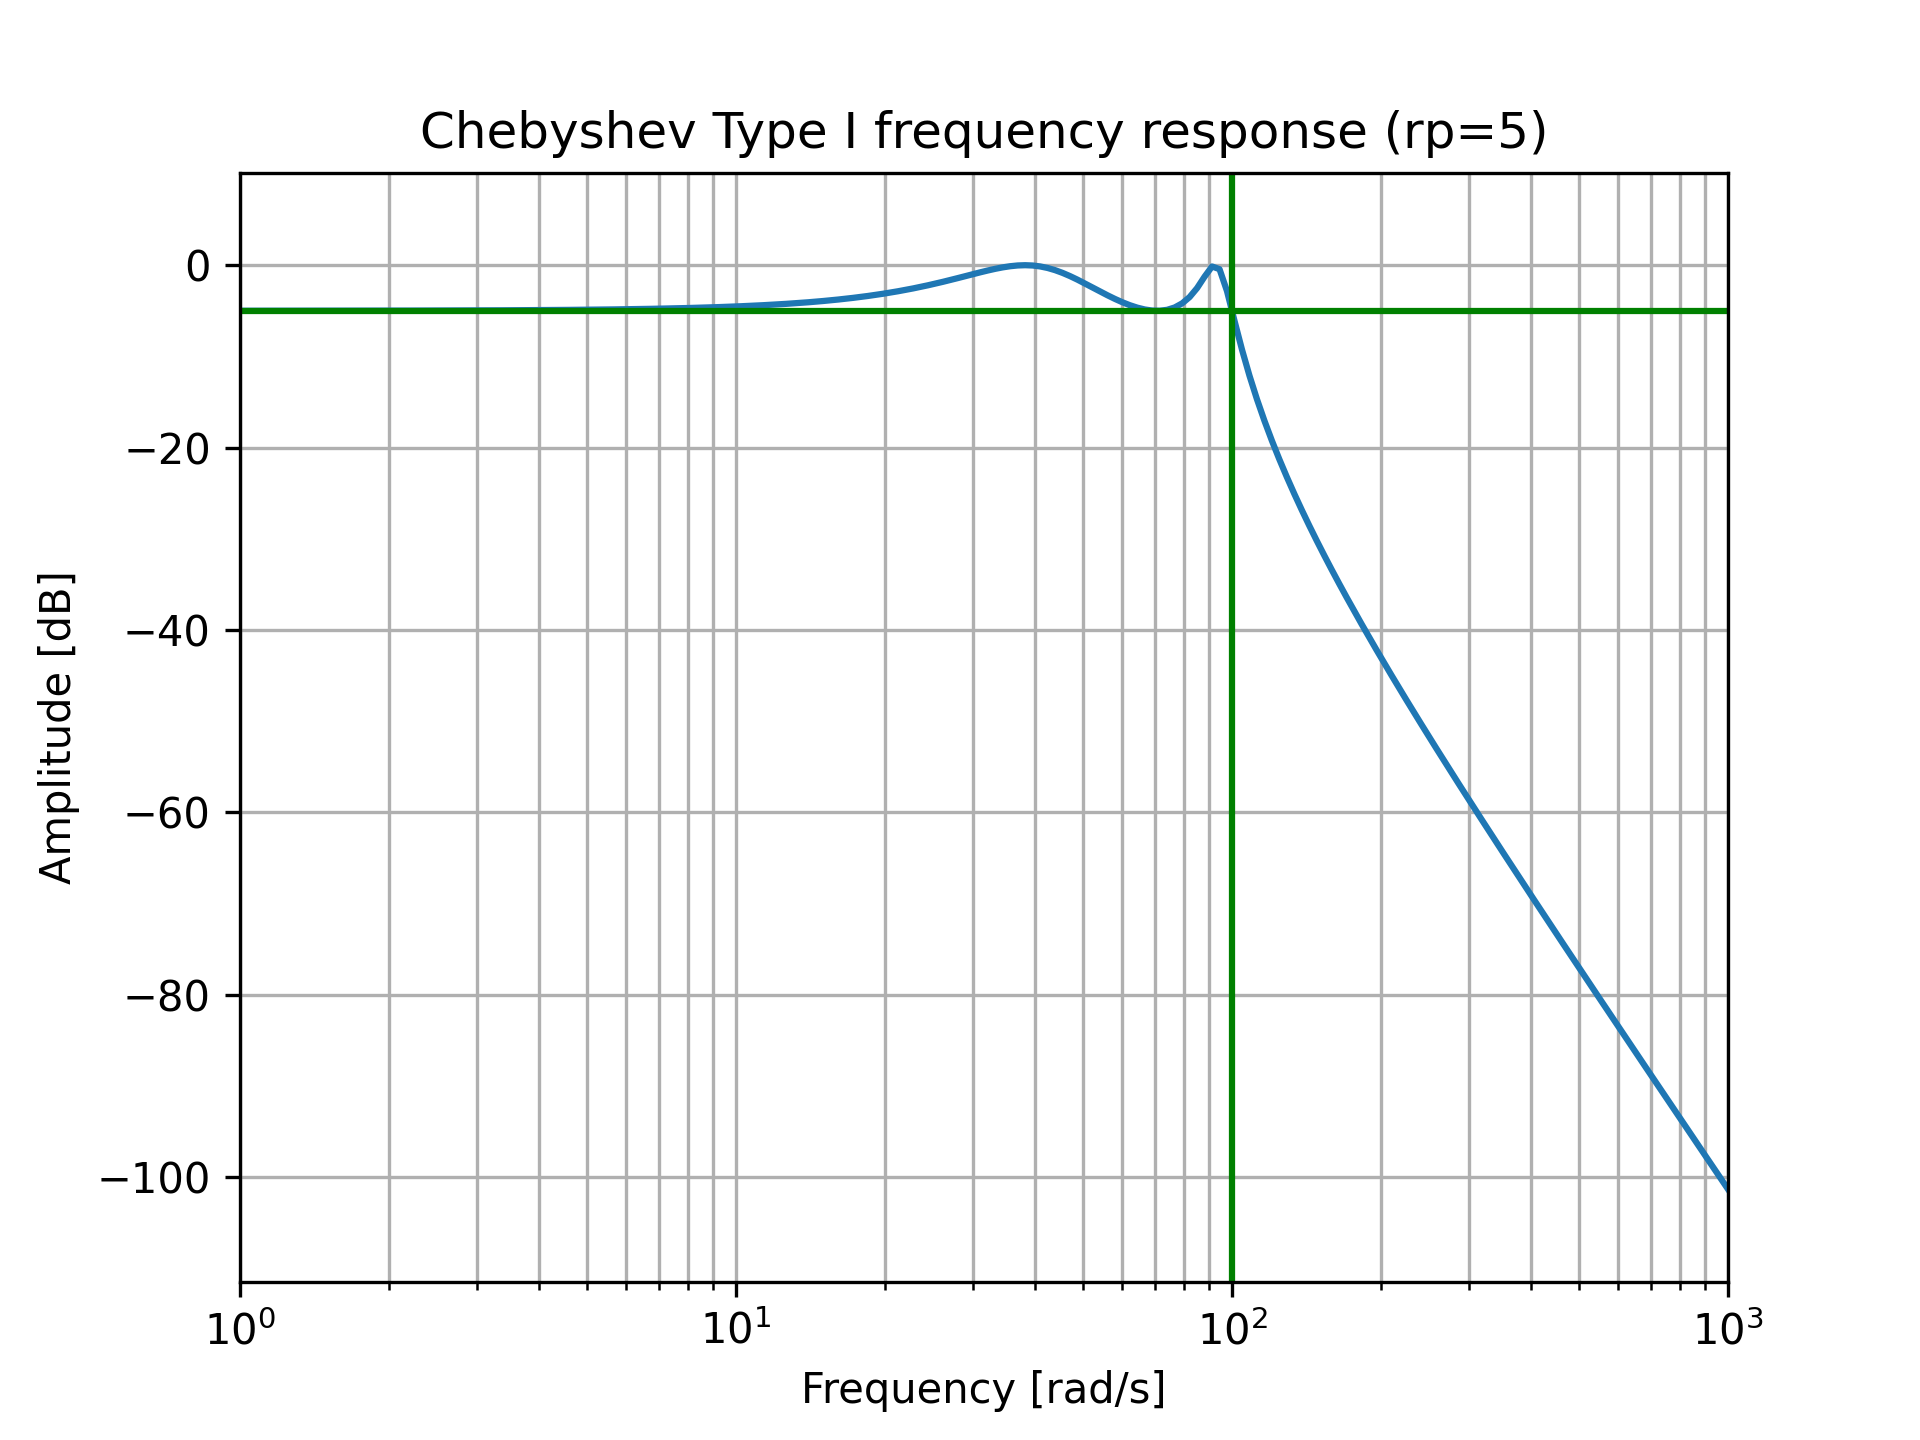
Design an analog filter and plot its frequency response, showing the critical points:from scipy import signal import matplotlib.pyplot as plt import numpy as np✓
b, a = signal.cheby1(4, 5, 100, 'low', analog=True)
w, h = signal.freqs(b, a)
✓
plt.semilogx(w, 20 * np.log10(abs(h)))
plt.title('Chebyshev Type I frequency response (rp=5)')
plt.xlabel('Frequency [rad/s]')
plt.ylabel('Amplitude [dB]')
✗
plt.margins(0, 0.1)
plt.grid(which='both', axis='both')
✓
plt.axvline(100, color='green') # cutoff frequency
plt.axhline(-5, color='green') # rp
✗
plt.show()
✓
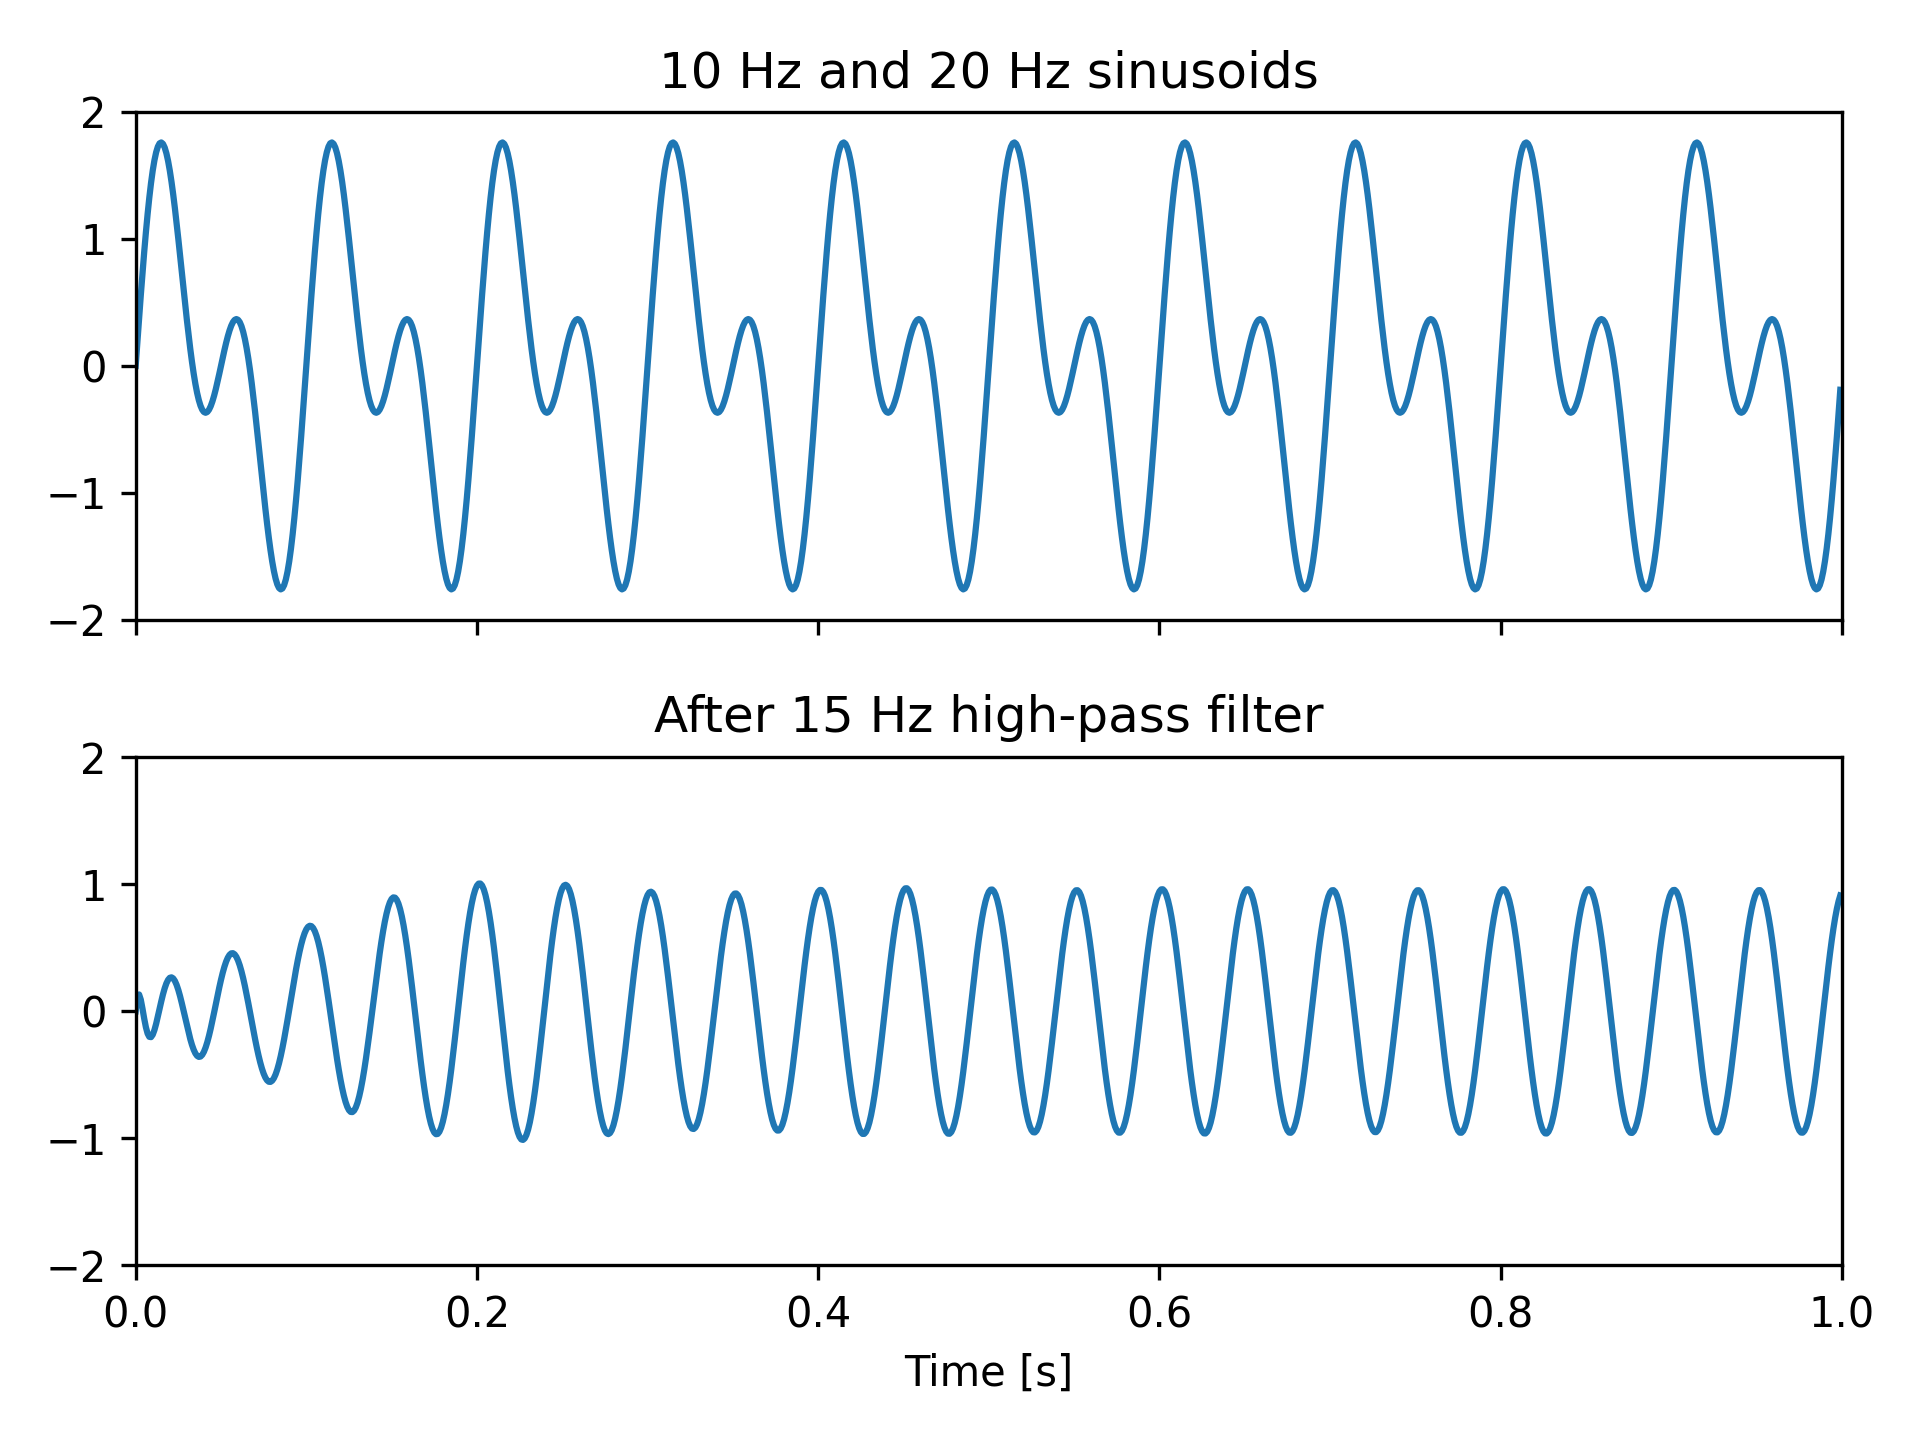
t = np.linspace(0, 1, 1000, False)  # 1 second
sig = np.sin(2*np.pi*10*t) + np.sin(2*np.pi*20*t)
fig, (ax1, ax2) = plt.subplots(2, 1, sharex=True)
✓
ax1.plot(t, sig)
ax1.set_title('10 Hz and 20 Hz sinusoids')
ax1.axis([0, 1, -2, 2])
✗
sos = signal.cheby1(10, 1, 15, 'hp', fs=1000, output='sos')
filtered = signal.sosfilt(sos, sig)
✓
ax2.plot(t, filtered)
ax2.set_title('After 15 Hz high-pass filter')
ax2.axis([0, 1, -2, 2])
ax2.set_xlabel('Time [s]')
✗
plt.tight_layout()
plt.show()
✓
See also
Aliases
-
scipy.signal.cheby1