bundles / scipy 1.17.1 / scipy / signal / _filter_design / ellipord
function
scipy.signal._filter_design:ellipord
Signature
def ellipord ( wp , ws , gpass , gstop , analog = False , fs = None ) Summary
Elliptic (Cauer) filter order selection.
Extended Summary
Return the order of the lowest order digital or analog elliptic filter that loses no more than gpass dB in the passband and has at least gstop dB attenuation in the stopband.
Parameters
wp, ws: floatPassband and stopband edge frequencies.
For digital filters, these are in the same units as
fs. By default,fsis 2 half-cycles/sample, so these are normalized from 0 to 1, where 1 is the Nyquist frequency. (wpandwsare thus in half-cycles / sample.) For example:Lowpass: wp = 0.2, ws = 0.3
Highpass: wp = 0.3, ws = 0.2
Bandpass: wp = [0.2, 0.5], ws = [0.1, 0.6]
Bandstop: wp = [0.1, 0.6], ws = [0.2, 0.5]
For analog filters,
wpandwsare angular frequencies (e.g., rad/s).gpass: floatThe maximum loss in the passband (dB).
gstop: floatThe minimum attenuation in the stopband (dB).
analog: bool, optionalWhen True, return an analog filter, otherwise a digital filter is returned.
fs: float, optionalThe sampling frequency of the digital system.
Returns
Notes
Array API Standard Support
ellipord has experimental support for Python Array API Standard compatible backends in addition to NumPy. Please consider testing these features by setting an environment variable SCIPY_ARRAY_API=1 and providing CuPy, PyTorch, JAX, or Dask arrays as array arguments. The following combinations of backend and device (or other capability) are supported.
====================  ====================  ====================
Library               CPU                   GPU
====================  ====================  ====================
NumPy                 ✅                     n/a
CuPy                  n/a                   ✅
PyTorch               ✅                     ⛔
JAX                   ⚠️ no JIT             ⛔
Dask                  ⚠️ computes graph     n/a
====================  ====================  ====================
See
dev-arrayapifor more information.
Examples
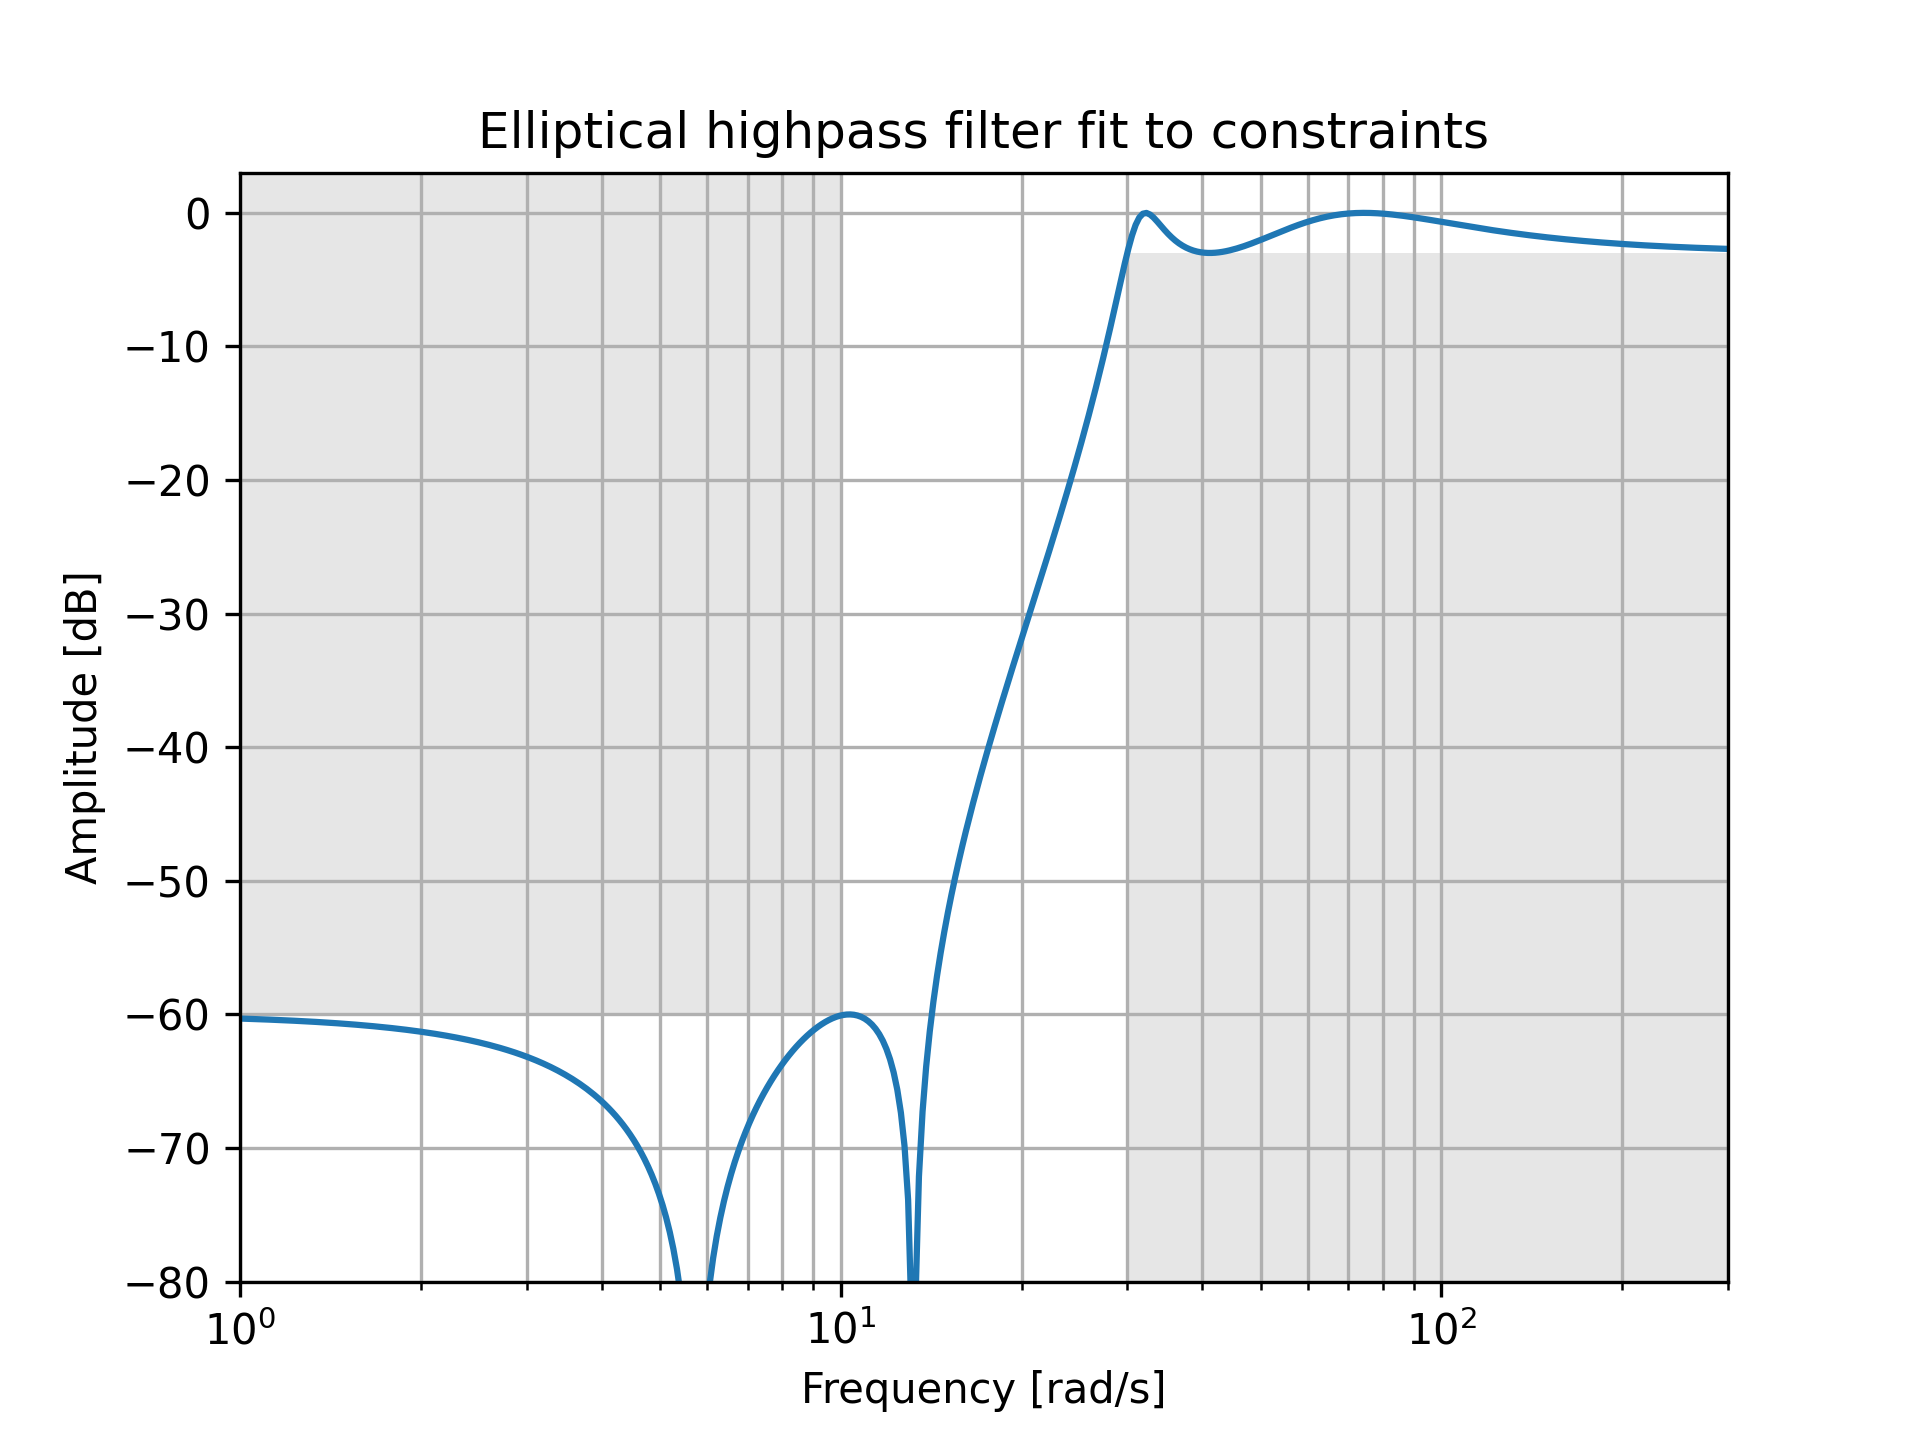
Design an analog highpass filter such that the passband is within 3 dB above 30 rad/s, while rejecting -60 dB at 10 rad/s. Plot its frequency response, showing the passband and stopband constraints in gray.from scipy import signal import matplotlib.pyplot as plt import numpy as np✓
N, Wn = signal.ellipord(30, 10, 3, 60, True)
b, a = signal.ellip(N, 3, 60, Wn, 'high', True)
w, h = signal.freqs(b, a, np.logspace(0, 3, 500))
✓
plt.semilogx(w, 20 * np.log10(abs(h)))
plt.title('Elliptical highpass filter fit to constraints')
plt.xlabel('Frequency [rad/s]')
plt.ylabel('Amplitude [dB]')
✗
plt.grid(which='both', axis='both')
✓plt.fill([.1, 10, 10, .1], [1e4, 1e4, -60, -60], '0.9', lw=0) # stop plt.fill([30, 30, 1e9, 1e9], [-99, -3, -3, -99], '0.9', lw=0) # pass plt.axis([1, 300, -80, 3])✗
plt.show()
✓
See also
Aliases
-
scipy.signal.ellipord