bundles / scipy 1.17.1 / scipy / spatial / transform / _rotation / Rotation
class
scipy.spatial.transform._rotation:Rotation
Signature
class Rotation ( quat : ArrayLike , normalize : bool = True , copy : bool = True , scalar_first : bool = False ) Members
-
__bool__ -
__getitem__ -
__getstate__ -
__init__ -
__iter__ -
__len__ -
__mul__ -
__pow__ -
__repr__ -
__setitem__ -
__setstate__ -
_from_raw_quat -
align_vectors -
apply -
approx_equal -
as_davenport -
as_euler -
as_matrix -
as_mrp -
as_quat -
as_rotvec -
concatenate -
create_group -
from_davenport -
from_euler -
from_matrix -
from_mrp -
from_quat -
from_rotvec -
identity -
inv -
magnitude -
mean -
random -
reduce
Summary
Rotation in 3 dimensions.
Extended Summary
This class provides an interface to initialize from and represent rotations with:
Quaternions
Rotation Matrices
Rotation Vectors
Modified Rodrigues Parameters
Euler Angles
Davenport Angles (Generalized Euler Angles)
The following operations on rotations are supported:
Application on vectors
Rotation Composition
Rotation Inversion
Rotation Indexing
A Rotation instance can contain a single rotation transform or rotations of multiple leading dimensions. E.g., it is possible to have an N-dimensional array of (N, M, K) rotations. When applied to other rotations or vectors, standard broadcasting rules apply.
Indexing within a rotation is supported to access a subset of the rotations stored in a Rotation instance.
To create Rotation objects use from_... methods (see examples below). Rotation(...) is not supposed to be instantiated directly.
Attributes
single
Methods
__len__from_quatfrom_matrixfrom_rotvecfrom_mrpfrom_eulerfrom_davenportas_quatas_matrixas_rotvecas_mrpas_euleras_davenportconcatenateapply__mul____pow__invmagnitudeapprox_equalmeanreducecreate_group__getitem__identityrandomalign_vectors
Notes
Examples
from scipy.spatial.transform import Rotation as R
import numpy as np
✓
r = R.from_quat([0, 0, np.sin(np.pi/4), np.cos(np.pi/4)])
✓r.as_matrix() r.as_rotvec() r.as_euler('zyx', degrees=True)✗
r = R.from_matrix([[0, -1, 0],
                   [1, 0, 0],
                   [0, 0, 1]])
✓
r.as_quat()
r.as_rotvec()
r.as_euler('zyx', degrees=True)
✗
r = R.from_rotvec(np.pi/2 * np.array([0, 0, 1]))
✓r.as_quat() r.as_matrix() r.as_euler('zyx', degrees=True)✗
r = R.from_euler('z', 90, degrees=True)
✓r.as_quat() r.as_matrix() r.as_rotvec()✗
r = R.from_euler('zyx', [
[90, 0, 0],
[0, 45, 0],
[45, 60, 30]], degrees=True)
✓
r.as_quat()
✗v = [1, 2, 3]
✓r.apply(v)
✗r.as_quat()
✗p = r[0]
✓p.as_matrix()
✗q = r[1:3]
✓q.as_quat()
✗r_array = np.asarray(r) r_array.shape✓
r_array[0].as_matrix()
✗r1 = R.from_euler('z', 90, degrees=True) r2 = R.from_rotvec([np.pi/4, 0, 0]) v = [1, 2, 3]✓
r2.apply(r1.apply(v))
✗r3 = r2 * r1 # Note the order
✓r3.apply(v)
✗p = R.from_rotvec([1, 0, 0]) q = p ** 2 q.as_rotvec()✓
r1 = R.from_euler('z', [[90], [45]], degrees=True)
r2 = r1.inv()
✓
r2.as_euler('zyx', degrees=True)
✗import matplotlib.pyplot as plt
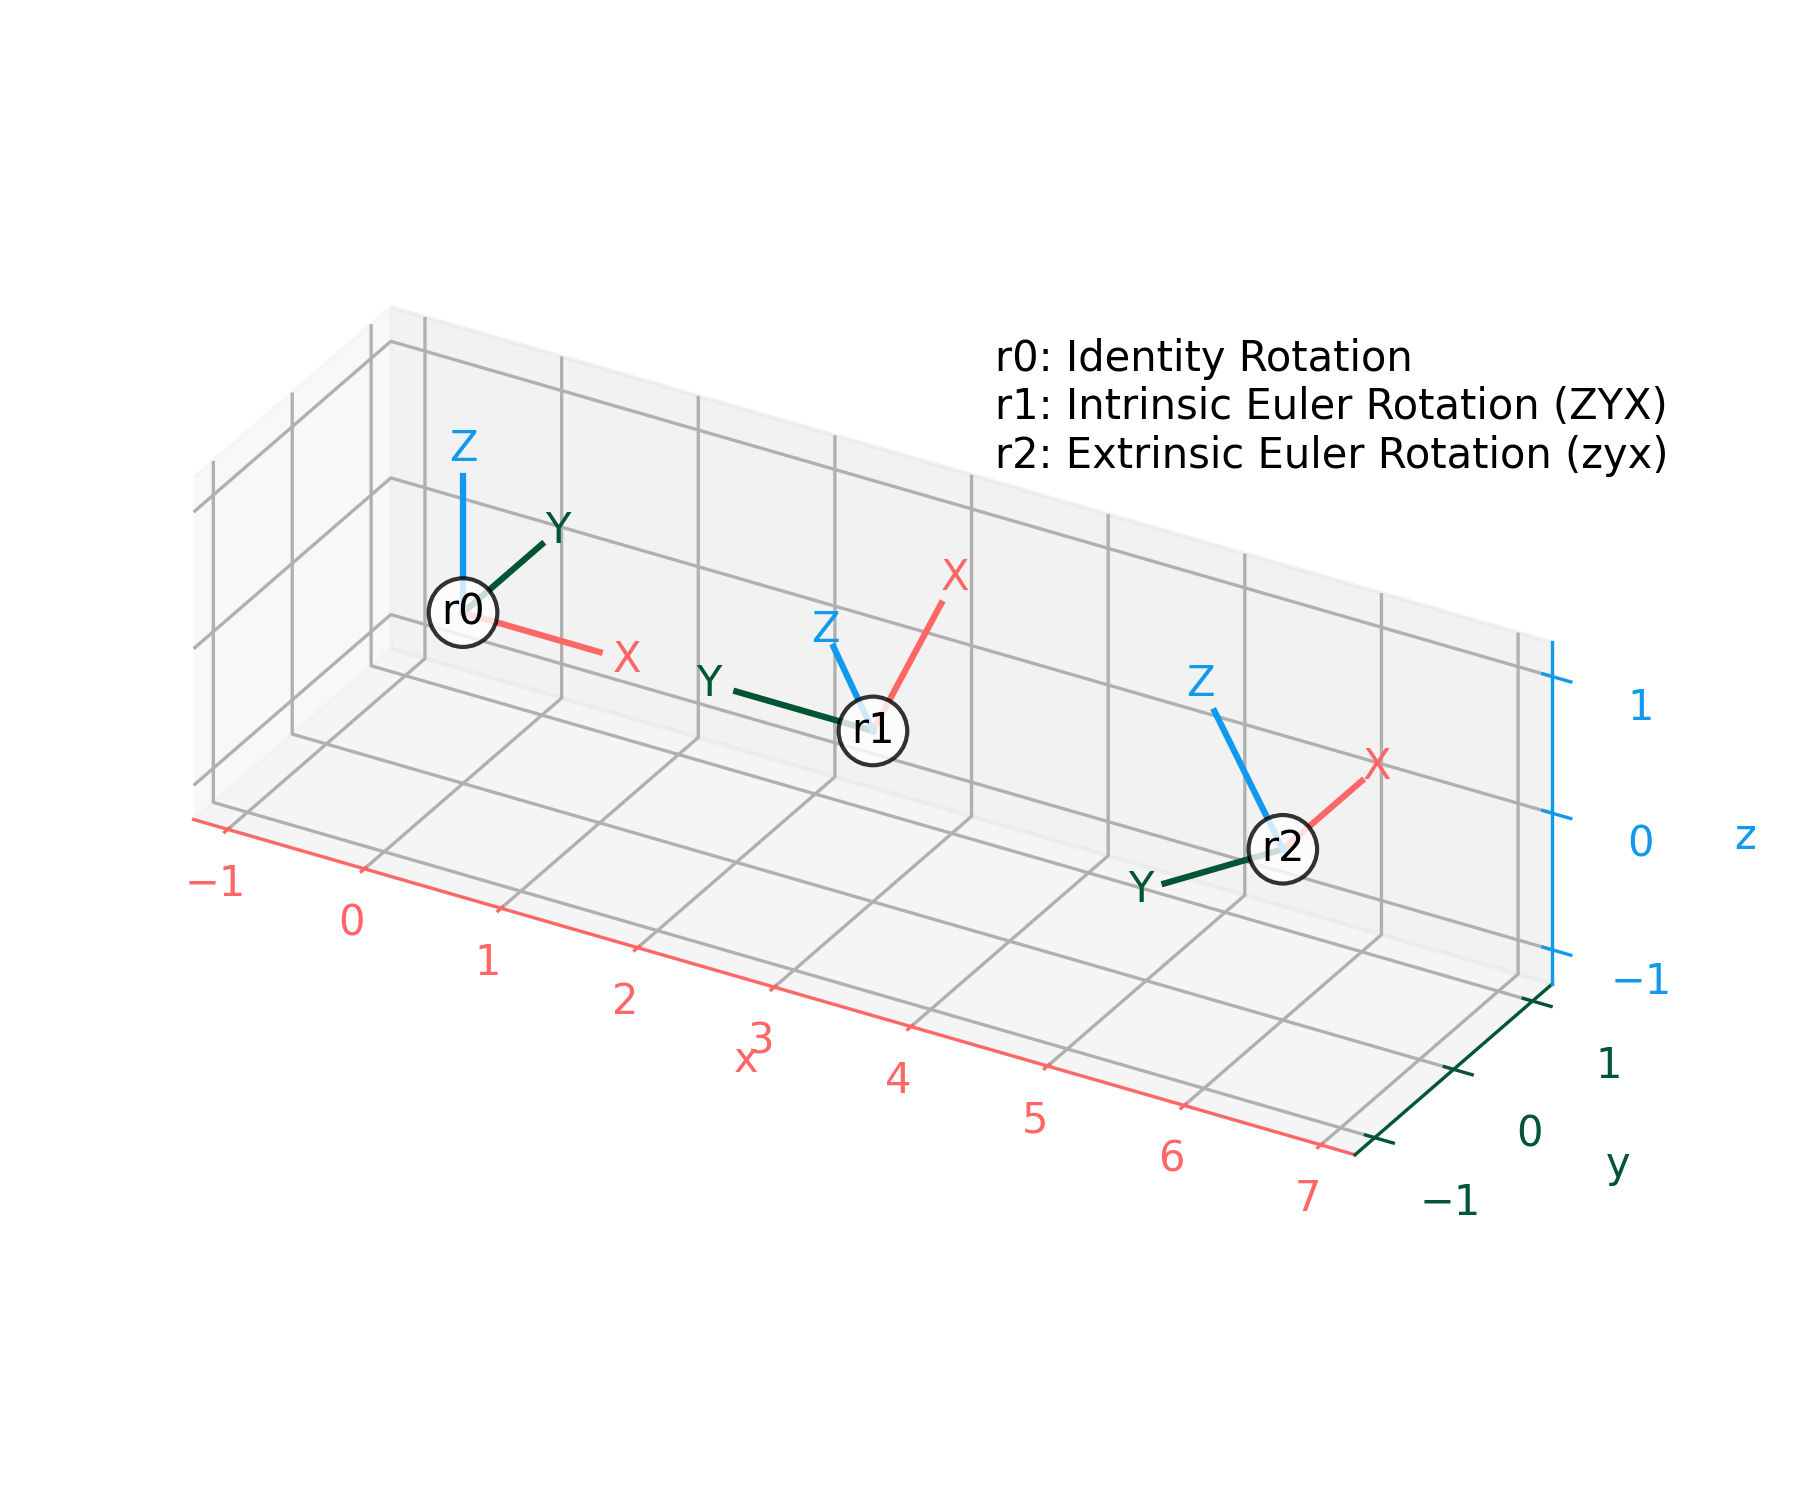
✓def plot_rotated_axes(ax, r, name=None, offset=(0, 0, 0), scale=1): colors = ("#FF6666", "#005533", "#1199EE") # Colorblind-safe RGB loc = np.array([offset, offset]) for i, (axis, c) in enumerate(zip((ax.xaxis, ax.yaxis, ax.zaxis), colors)): axlabel = axis.axis_name axis.set_label_text(axlabel) axis.label.set_color(c) axis.line.set_color(c) axis.set_tick_params(colors=c) line = np.zeros((2, 3)) line[1, i] = scale line_rot = r.apply(line) line_plot = line_rot + loc ax.plot(line_plot[:, 0], line_plot[:, 1], line_plot[:, 2], c) text_loc = line[1]*1.2 text_loc_rot = r.apply(text_loc) text_plot = text_loc_rot + loc[0] ax.text(*text_plot, axlabel.upper(), color=c, va="center", ha="center") ax.text(*offset, name, color="k", va="center", ha="center", bbox={"fc": "w", "alpha": 0.8, "boxstyle": "circle"})✓
r0 = R.identity()
r1 = R.from_euler("ZYX", [90, -30, 0], degrees=True)  # intrinsic
r2 = R.from_euler("zyx", [90, -30, 0], degrees=True)  # extrinsic
✓
ax = plt.figure().add_subplot(projection="3d", proj_type="ortho")
plot_rotated_axes(ax, r0, name="r0", offset=(0, 0, 0))
plot_rotated_axes(ax, r1, name="r1", offset=(3, 0, 0))
plot_rotated_axes(ax, r2, name="r2", offset=(6, 0, 0))
_ = ax.annotate(
    "r0: Identity Rotation\n"
    "r1: Intrinsic Euler Rotation (ZYX)\n"
    "r2: Extrinsic Euler Rotation (zyx)",
    xy=(0.6, 0.7), xycoords="axes fraction", ha="left"
)
✓
ax.set(xlim=(-1.25, 7.25), ylim=(-1.25, 1.25), zlim=(-1.25, 1.25))
ax.set(xticks=range(-1, 8), yticks=[-1, 0, 1], zticks=[-1, 0, 1])
✗
ax.set_aspect("equal", adjustable="box")
ax.figure.set_size_inches(6, 5)
plt.tight_layout()
✓
plt.show()
✓
See also
Aliases
-
scipy.spatial.transform.Rotation