bundles / scipy 2.0.0.dev0+git20260907.41eeb59 / scipy / signal / _ltisys / dfreqresp
function
scipy.signal._ltisys:dfreqresp
source: build-install/usr/lib/python3.14/site-packages/scipy/signal/_ltisys.py:3652
Signature
def dfreqresp(system, w = None, n = 10000, whole = False)Summary
Calculate the frequency response of a discrete-time system.
Parameters
system: dlti | tupleAn instance of the LTI class dlti or a tuple describing the system. The number of elements in the tuple determine the interpretation. I.e.:
system: Instance of LTI class dlti. Note that derived instances, such as instances of TransferFunction, ZerosPolesGain, or StateSpace, are allowed as well.(num, den, dt): Rational polynomial as described in TransferFunction. The coefficients of the polynomials should be specified in descending exponent order, e.g., z² + 3z + 5 would be represented as[1, 3, 5].(zeros, poles, gain, dt): Zeros, poles, gain form as described in ZerosPolesGain.(A, B, C, D, dt): State-space form as described in StateSpace.
w: array_like, optionalArray of frequencies (in radians/sample). Magnitude and phase data is calculated for every value in this array. If not given a reasonable set will be calculated.
n: int, optionalNumber of frequency points to compute if
wis not given. Thenfrequencies are logarithmically spaced in an interval chosen to include the influence of the poles and zeros of the system.whole: bool, optionalNormally, if 'w' is not given, frequencies are computed from 0 to the Nyquist frequency, pi radians/sample (upper-half of unit-circle). If
wholeis True, compute frequencies from 0 to 2*pi radians/sample.
Returns
w: 1D ndarrayFrequency array [radians/sample]
H: 1D ndarrayArray of complex magnitude values
Notes
If (num, den) is passed in for system, coefficients for both the numerator and denominator should be specified in descending exponent order (e.g. z^2 + 3z + 5 would be represented as [1, 3, 5]).
Examples
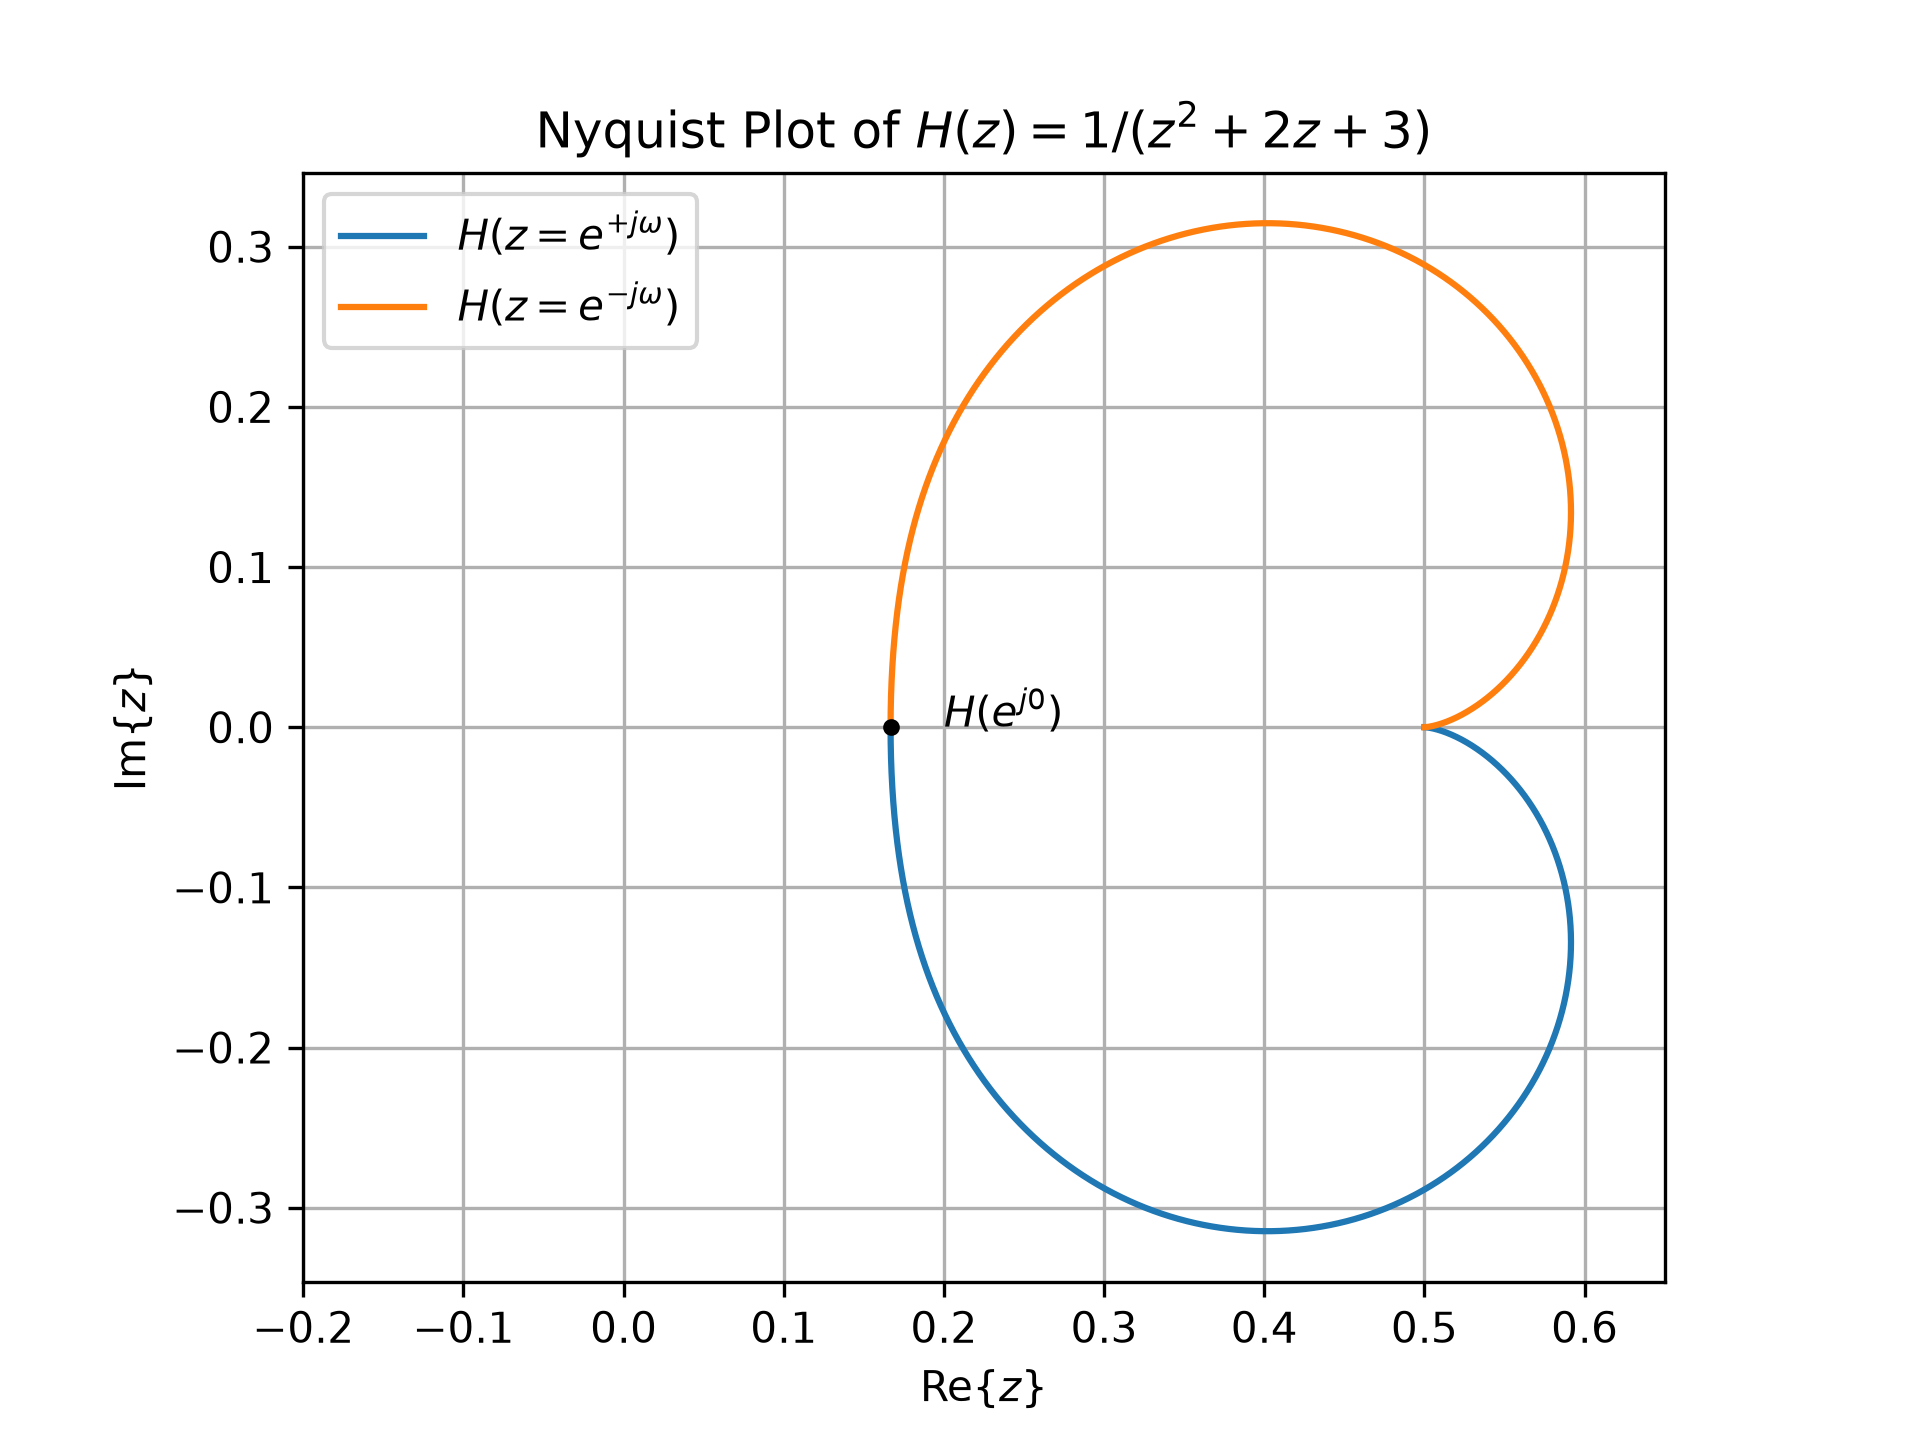
The following example generates the Nyquist plot of the transfer function :math:`H(z) = \frac{1}{z^2 + 2z + 3}` with a sampling time of 0.05 seconds:from scipy import signal import matplotlib.pyplot as plt sys = signal.TransferFunction([1], [1, 2, 3], dt=0.05) # construct H(z) w, H = signal.dfreqresp(sys) fig0, ax0 = plt.subplots()✓
ax0.plot(H.real, H.imag, label=r"$H(z=e^{+j\omega})$")
ax0.plot(H.real, -H.imag, label=r"$H(z=e^{-j\omega})$")
ax0.set_title(r"Nyquist Plot of $H(z) = 1 / (z^2 + 2z + 3)$")
ax0.set(xlabel=r"$\text{Re}\{z\}$", ylabel=r"$\text{Im}\{z\}$",
        xlim=(-0.2, 0.65), aspect='equal')
ax0.plot(H[0].real, H[0].imag, 'k.')  # mark H(exp(1j*w[0]))
ax0.text(0.2, 0, r"$H(e^{j0})$")
✗
Text(0.2, 0, '$H(e^{j0})$')
ax0.grid(True)
✓ax0.legend()
✗<matplotlib.legend.Legend object at 0x7f3f688641a0>
plt.show()
✓
Aliases
scipy.signal.dfreqresp