bundles / scipy 2.0.0.dev0+git20260907.41eeb59 / scipy / signal / _ltisys / lsim
function
scipy.signal._ltisys:lsim
source: build-install/usr/lib/python3.14/site-packages/scipy/signal/_ltisys.py:2066
Signature
def lsim(system, U, T, X0 = None, interp = True)Summary
Simulate output of a continuous-time linear system.
Parameters
system: an instance of the LTI class or a tuple describing the systemThe following gives the number of elements in the tuple and the interpretation:
1: (instance of lti)
2: (num, den)
3: (zeros, poles, gain)
4: (A, B, C, D)
U: array_likeAn input array describing the input at each time
T(interpolation is assumed between given times). If there are multiple inputs, then each column of the rank-2 array represents an input. If U = 0 or None, a zero input is used.T: array_likeThe time steps at which the input is defined and at which the output is desired. Must be nonnegative, increasing, and equally spaced.
X0: array_like, optionalThe initial conditions on the state vector (zero by default).
interp: bool, optionalWhether to use linear (True, the default) or zero-order-hold (False) interpolation for the input array.
Returns
T: 1D ndarrayTime values for the output.
yout: 1D ndarraySystem response.
xout: ndarrayTime evolution of the state vector.
Notes
If (num, den) is passed in for system, coefficients for both the numerator and denominator should be specified in descending exponent order (e.g. s^2 + 3s + 5 would be represented as [1, 3, 5]).
Examples
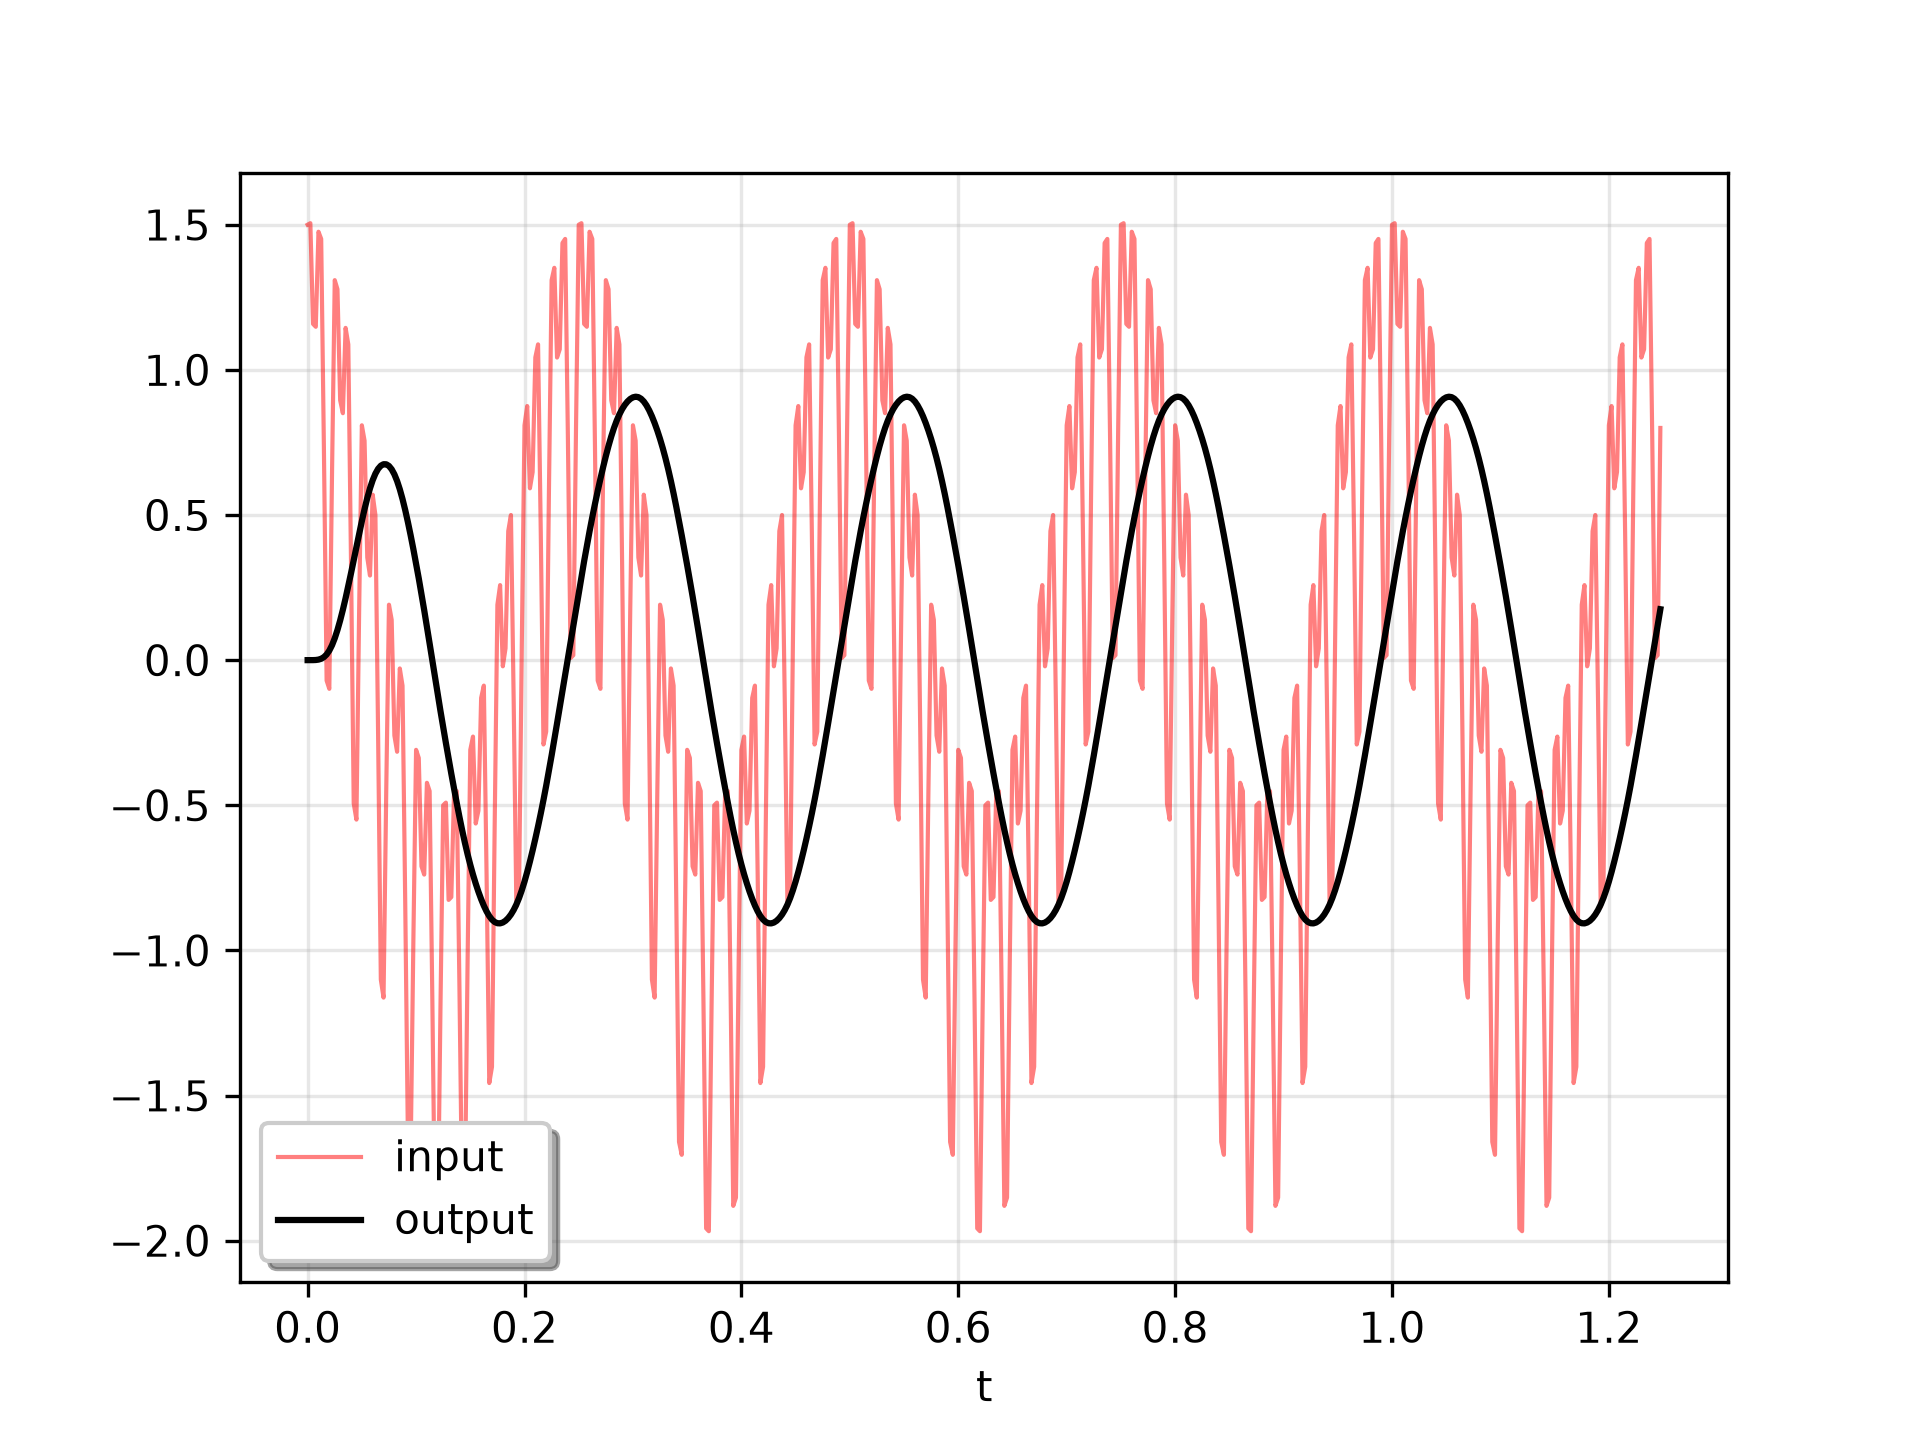
We'll use `lsim` to simulate an analog Bessel filter applied to a signal.import numpy as np from scipy.signal import bessel, lsim import matplotlib.pyplot as plt✓
b, a = bessel(N=5, Wn=2*np.pi*12, btype='lowpass', analog=True)
✓t = np.linspace(0, 1.25, 500, endpoint=False)
✓u = (np.cos(2*np.pi*4*t) + 0.6*np.sin(2*np.pi*40*t) + 0.5*np.cos(2*np.pi*80*t))✓
tout, yout, xout = lsim((b, a), U=u, T=t)
✓plt.plot(t, u, 'r', alpha=0.5, linewidth=1, label='input') plt.plot(tout, yout, 'k', linewidth=1.5, label='output') plt.legend(loc='best', shadow=True, framealpha=1)✗
<matplotlib.legend.Legend object at 0x7f3f68551160>
plt.grid(alpha=0.3)
✓plt.xlabel('t')
✗Text(0.5, 0, 't')
plt.show()
✓
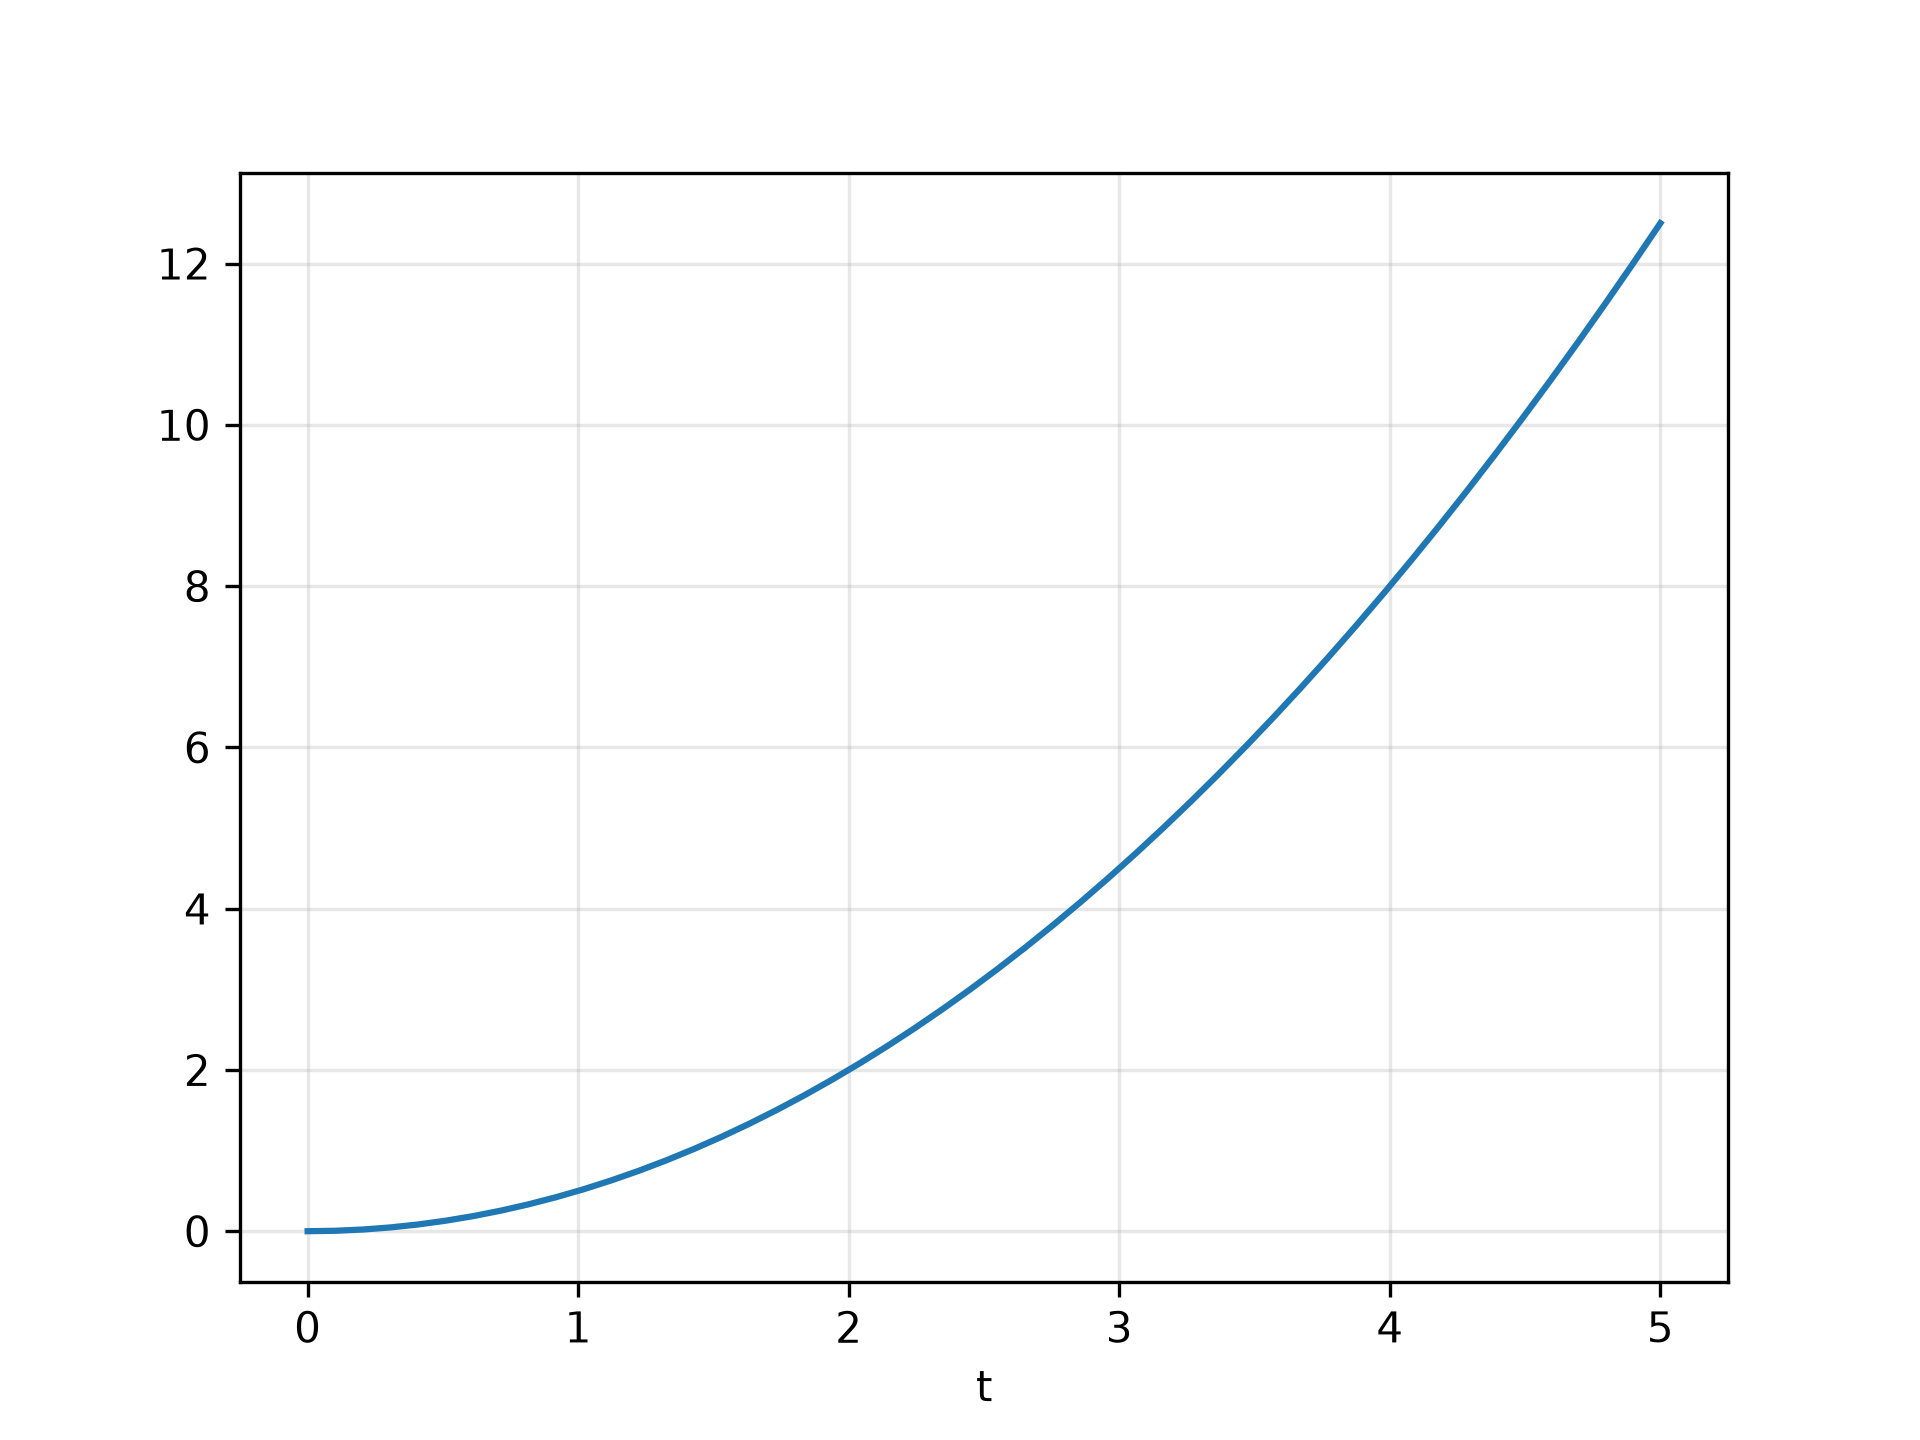
from scipy.signal import lti
A = np.array([[0.0, 1.0], [0.0, 0.0]])
B = np.array([[0.0], [1.0]])
C = np.array([[1.0, 0.0]])
D = 0.0
system = lti(A, B, C, D)
✓
t = np.linspace(0, 5, num=50)
u = np.ones_like(t)
✓
tout, y, x = lsim(system, u, t)
✓plt.plot(t, y)
✗[<matplotlib.lines.Line2D object at 0x7f3f69161160>]
plt.grid(alpha=0.3)
✓plt.xlabel('t')
✗Text(0.5, 0, 't')
plt.show()
✓
Aliases
scipy.signal.lsim