bundles / scipy 2.0.0.dev0+git20260907.41eeb59 / scipy / signal / _ltisys / dstep
function
scipy.signal._ltisys:dstep
source: build-install/usr/lib/python3.14/site-packages/scipy/signal/_ltisys.py:3556
Signature
def dstep(system, x0 = None, t = None, n = None)Summary
Step response of discrete-time system.
Parameters
system: dlti | tupleAn instance of the LTI class dlti or a tuple describing the system. The number of elements in the tuple determine the interpretation. I.e.:
system: Instance of LTI class dlti. Note that derived instances, such as instances of TransferFunction, ZerosPolesGain, or StateSpace, are allowed as well.(num, den, dt): Rational polynomial as described in TransferFunction. The coefficients of the polynomials should be specified in descending exponent order, e.g., z² + 3z + 5 would be represented as[1, 3, 5].(zeros, poles, gain, dt): Zeros, poles, gain form as described in ZerosPolesGain.(A, B, C, D, dt): State-space form as described in StateSpace.
x0: array_like, optionalInitial state-vector. Defaults to zero.
t: array_like, optionalTime points. Computed if not given.
n: int, optionalThe number of time points to compute (if
tis not given).
Returns
tout: ndarrayOutput time points, as a 1-D array.
yout: tuple of ndarrayStep response of system. Each element of the tuple represents the output of the system based on a step response to each input.
Examples
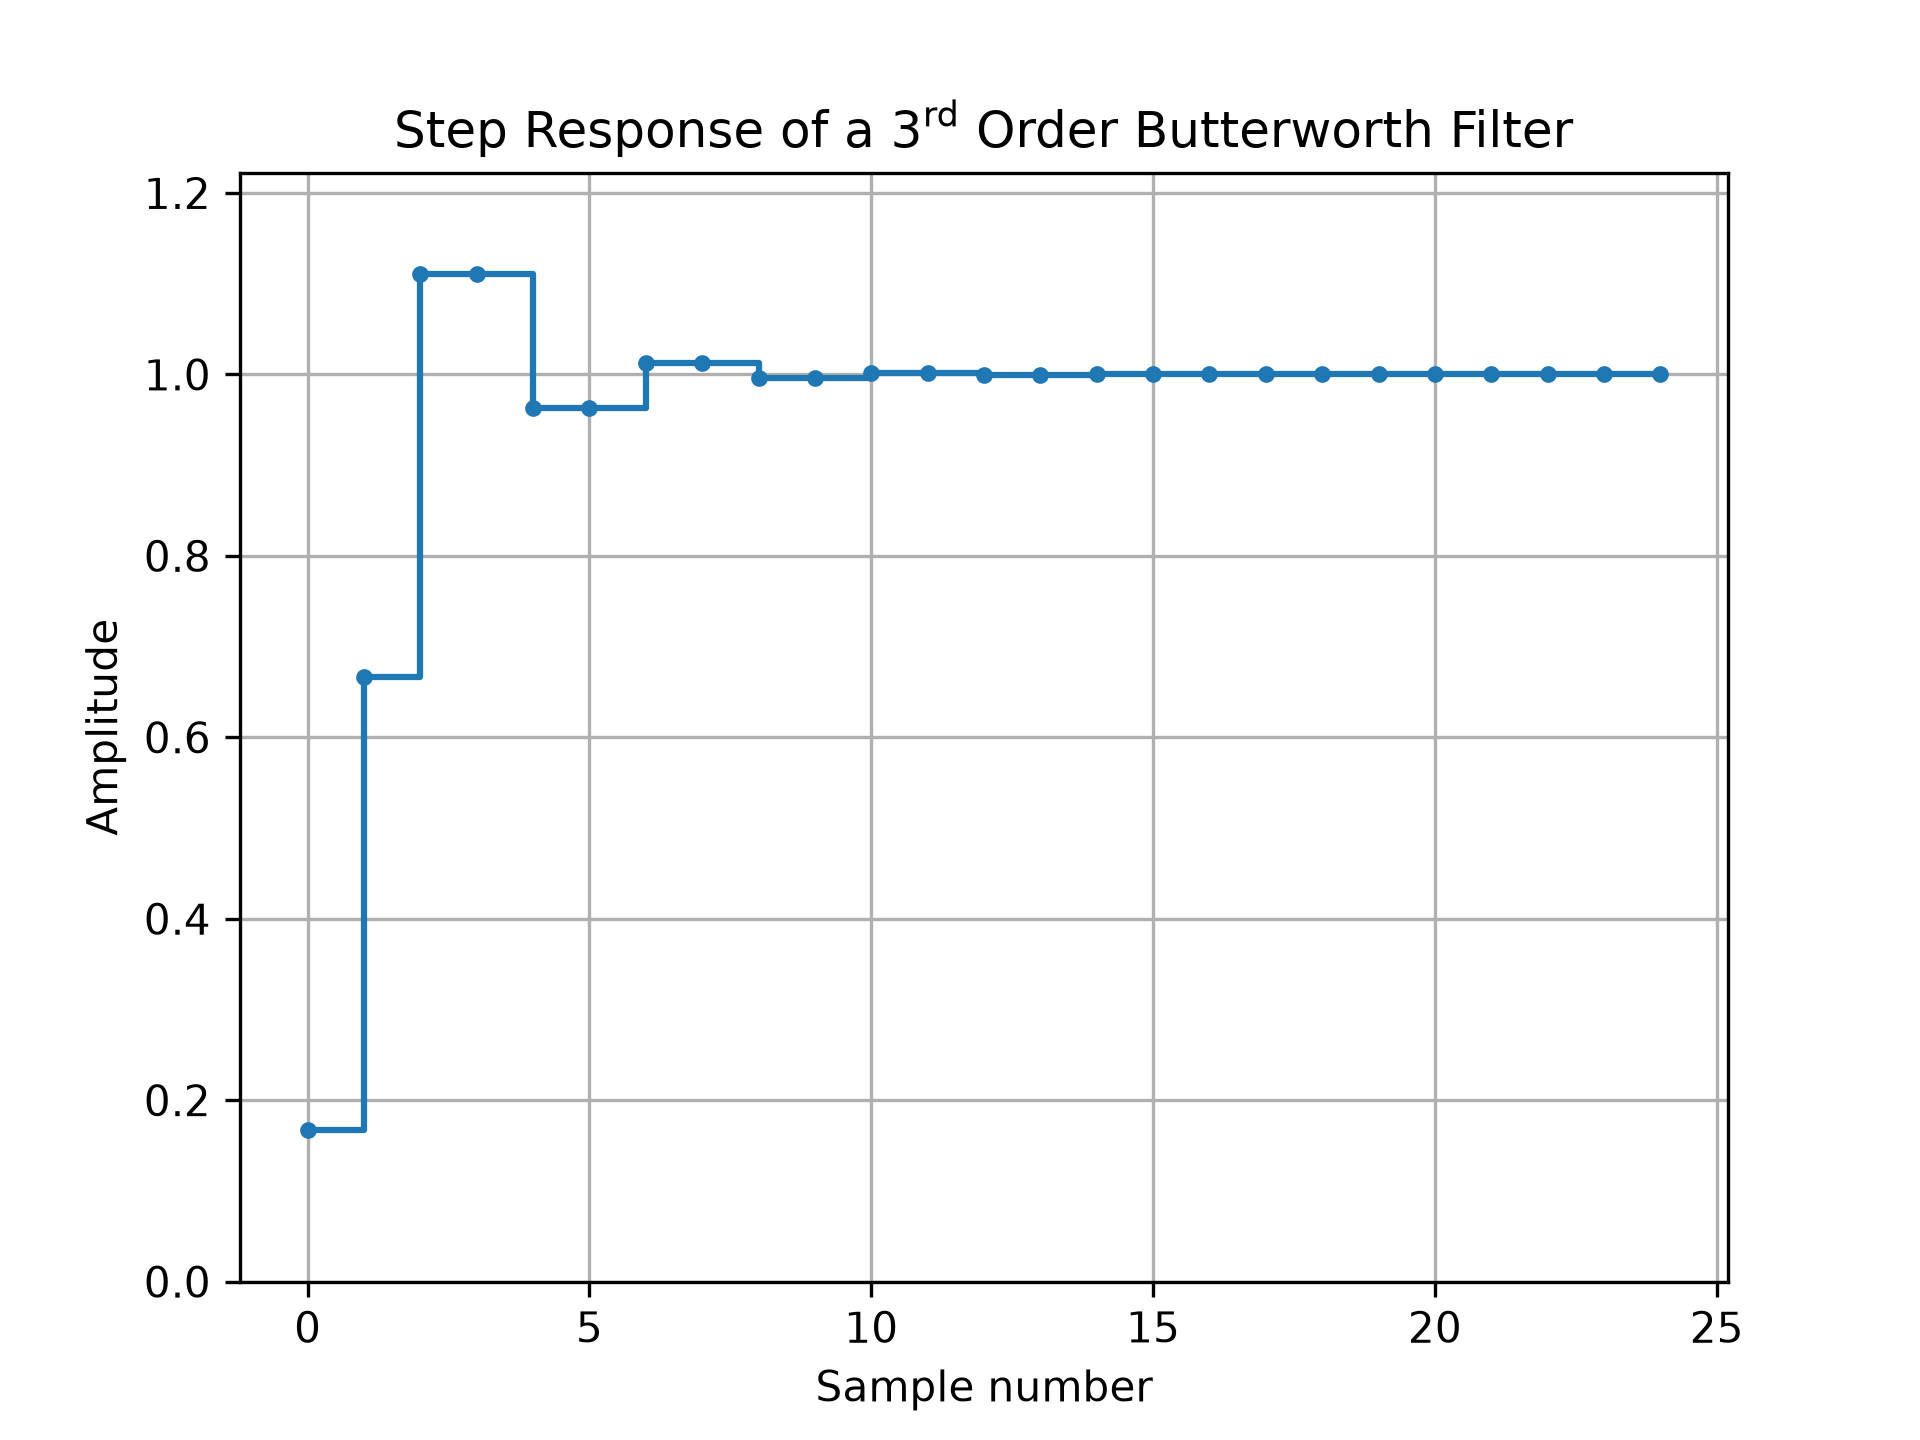
The following example illustrates how to create a digital Butterworth filer and plot its step response:import numpy as np from scipy import signal import matplotlib.pyplot as plt dt = 1 # sampling interval is one => time unit is sample number bb, aa = signal.butter(3, 0.25, fs=1/dt) t, y = signal.dstep((bb, aa, dt), n=25) fig0, ax0 = plt.subplots()✓
ax0.step(t, np.squeeze(y), '.-', where='post')
ax0.set_title(r"Step Response of a $3^\text{rd}$ Order Butterworth Filter")
ax0.set(xlabel='Sample number', ylabel='Amplitude', ylim=(0, 1.1*np.max(y)))
✗
[Text(0.5, 0, 'Sample number'), Text(0, 0.5, 'Amplitude'), (0.0, 1.2222222222222223)]
ax0.grid()
plt.show()
✓
See also
Aliases
scipy.signal.dstep