bundles / scipy 2.0.0.dev0+git20260907.41eeb59 / scipy / signal / _signaltools / hilbert
function
scipy.signal._signaltools:hilbert
source: build-install/usr/lib/python3.14/site-packages/scipy/signal/_signaltools.py:2474
Signature
def hilbert(x, N = None, axis = -1)Summary
FFT-based computation of the analytic signal.
Extended Summary
The analytic signal is calculated by zeroing out the negative frequencies and doubling the amplitudes of the positive frequencies in the FFT domain. The imaginary part of the result is the hilbert transform of the real-valued input signal.
The transformation is done along the last axis by default.
For numpy arrays, scipy.fft.set_workers can be used to change the number of workers used for the FFTs.
Parameters
x: array_likeSignal data. Must be real.
N: int, optionalNumber of output samples.
xis initially cropped or zero-padded to lengthNalongaxis. Default:x.shape[axis]axis: int, optionalAxis along which to do the transformation. Default: -1.
Returns
xa: ndarrayAnalytic signal of
x, of each 1-D array alongaxis
Notes
The analytic signal x_a(t) of a real-valued signal x(t) can be expressed as [1]
where F is the Fourier transform, U the unit step function, and y the Hilbert transform of x. [2]
In other words, the negative half of the frequency spectrum is zeroed out, turning the real-valued signal into a complex-valued signal. The Hilbert transformed signal can be obtained from np.imag(hilbert(x)), and the original signal from np.real(hilbert(x)).
Examples
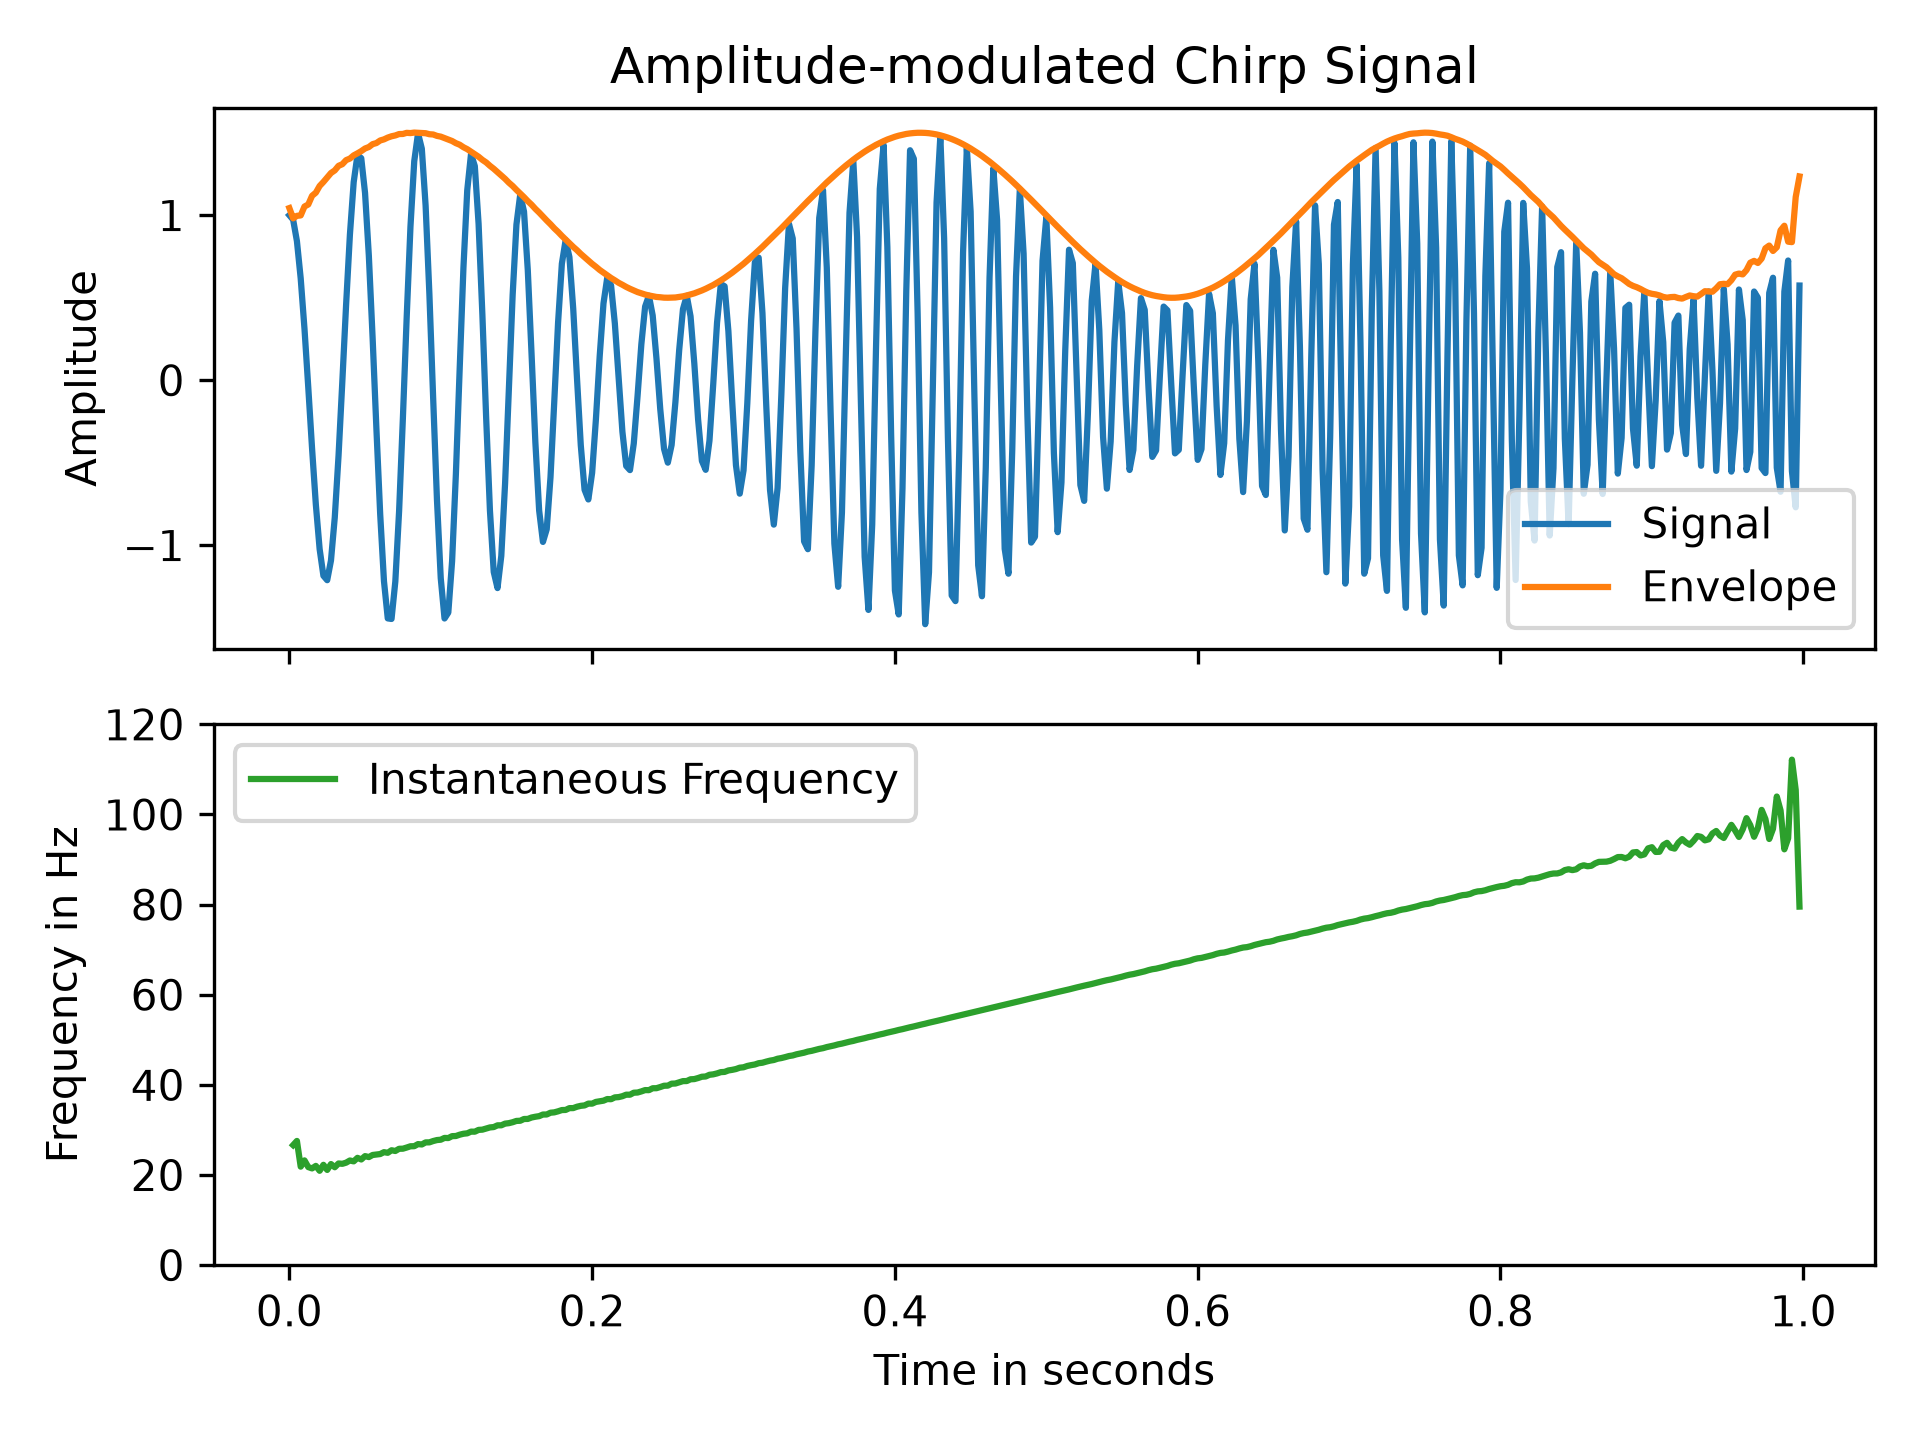
In this example we use the Hilbert transform to determine the amplitude envelope and instantaneous frequency of an amplitude-modulated signal. Let's create a chirp of which the frequency increases from 20 Hz to 100 Hz and apply an amplitude modulation:import numpy as np import matplotlib.pyplot as plt from scipy.signal import hilbert, chirp duration, fs = 1, 400 # 1 s signal with sampling frequency of 400 Hz t = np.arange(int(fs*duration)) / fs # timestamps of samples signal = chirp(t, 20.0, t[-1], 100.0) signal *= (1.0 + 0.5 * np.sin(2.0*np.pi*3.0*t) )✓
analytic_signal = hilbert(signal)
amplitude_envelope = np.abs(analytic_signal)
instantaneous_phase = np.unwrap(np.angle(analytic_signal))
instantaneous_frequency = np.diff(instantaneous_phase) / (2.0*np.pi) * fs
fig, (ax0, ax1) = plt.subplots(nrows=2, sharex='all', tight_layout=True)
✓
ax0.set_title("Amplitude-modulated Chirp Signal")
ax0.set_ylabel("Amplitude")
ax0.plot(t, signal, label='Signal')
ax0.plot(t, amplitude_envelope, label='Envelope')
ax0.legend()
ax1.set(xlabel="Time in seconds", ylabel="Frequency in Hz", ylim=(0, 120))
ax1.plot(t[1:], instantaneous_frequency, 'C2-',
         label='Instantaneous Frequency')
ax1.legend()
✗
<matplotlib.legend.Legend object at 0x7f3f60fec830>
plt.show()
✓
See also
- envelope
Compute envelope of a real- or complex-valued signal.
Aliases
scipy.signal.hilbert