bundles / scipy 2.0.0.dev0+git20260907.41eeb59 / scipy / signal / _signaltools / sosfiltfilt
function
scipy.signal._signaltools:sosfiltfilt
source: build-install/usr/lib/python3.14/site-packages/scipy/signal/_signaltools.py:5270
Signature
def sosfiltfilt(sos, x, axis = -1, padtype = odd, padlen = None)Summary
A forward-backward digital filter using cascaded second-order sections.
Extended Summary
See filtfilt for more complete information about this method.
Parameters
sos: array_likeArray of second-order filter coefficients, must have shape
(n_sections, 6). Each row corresponds to a second-order section, with the first three columns providing the numerator coefficients and the last three providing the denominator coefficients.x: array_likeThe array of data to be filtered.
axis: int, optionalThe axis of
xto which the filter is applied. Default is -1.padtype: str or None, optionalMust be 'odd', 'even', 'constant', or None. This determines the type of extension to use for the padded signal to which the filter is applied. If
padtypeis None, no padding is used. The default is 'odd'.padlen: int or None, optionalThe number of elements by which to extend
xat both ends ofaxisbefore applying the filter. This value must be less thanx.shape[axis] - 1.padlen=0implies no padding. The default value is3 * (2 * len(sos) + 1 - min((sos[:, 2] == 0).sum(), (sos[:, 5] == 0).sum()))
The extra subtraction at the end attempts to compensate for poles and zeros at the origin (e.g. for odd-order filters) to yield equivalent estimates of
padlento those of filtfilt for second-order section filters built with scipy.signal functions.
Returns
y: ndarrayThe filtered output with the same shape as
x.
Notes
Examples
import numpy as np
from scipy.signal import sosfiltfilt, butter
import matplotlib.pyplot as plt
rng = np.random.default_rng()
✓
n = 201
t = np.linspace(0, 1, n)
x = 1 + (t < 0.5) - 0.25*t**2 + 0.05*rng.standard_normal(n)
✓
sos = butter(4, 0.125, output='sos')
y = sosfiltfilt(sos, x)
✓
from scipy.signal import sosfilt, sosfilt_zi
sos8 = butter(8, 0.125, output='sos')
zi = x[:4].mean() * sosfilt_zi(sos8)
y2, zo = sosfilt(sos8, x, zi=zi)
✓
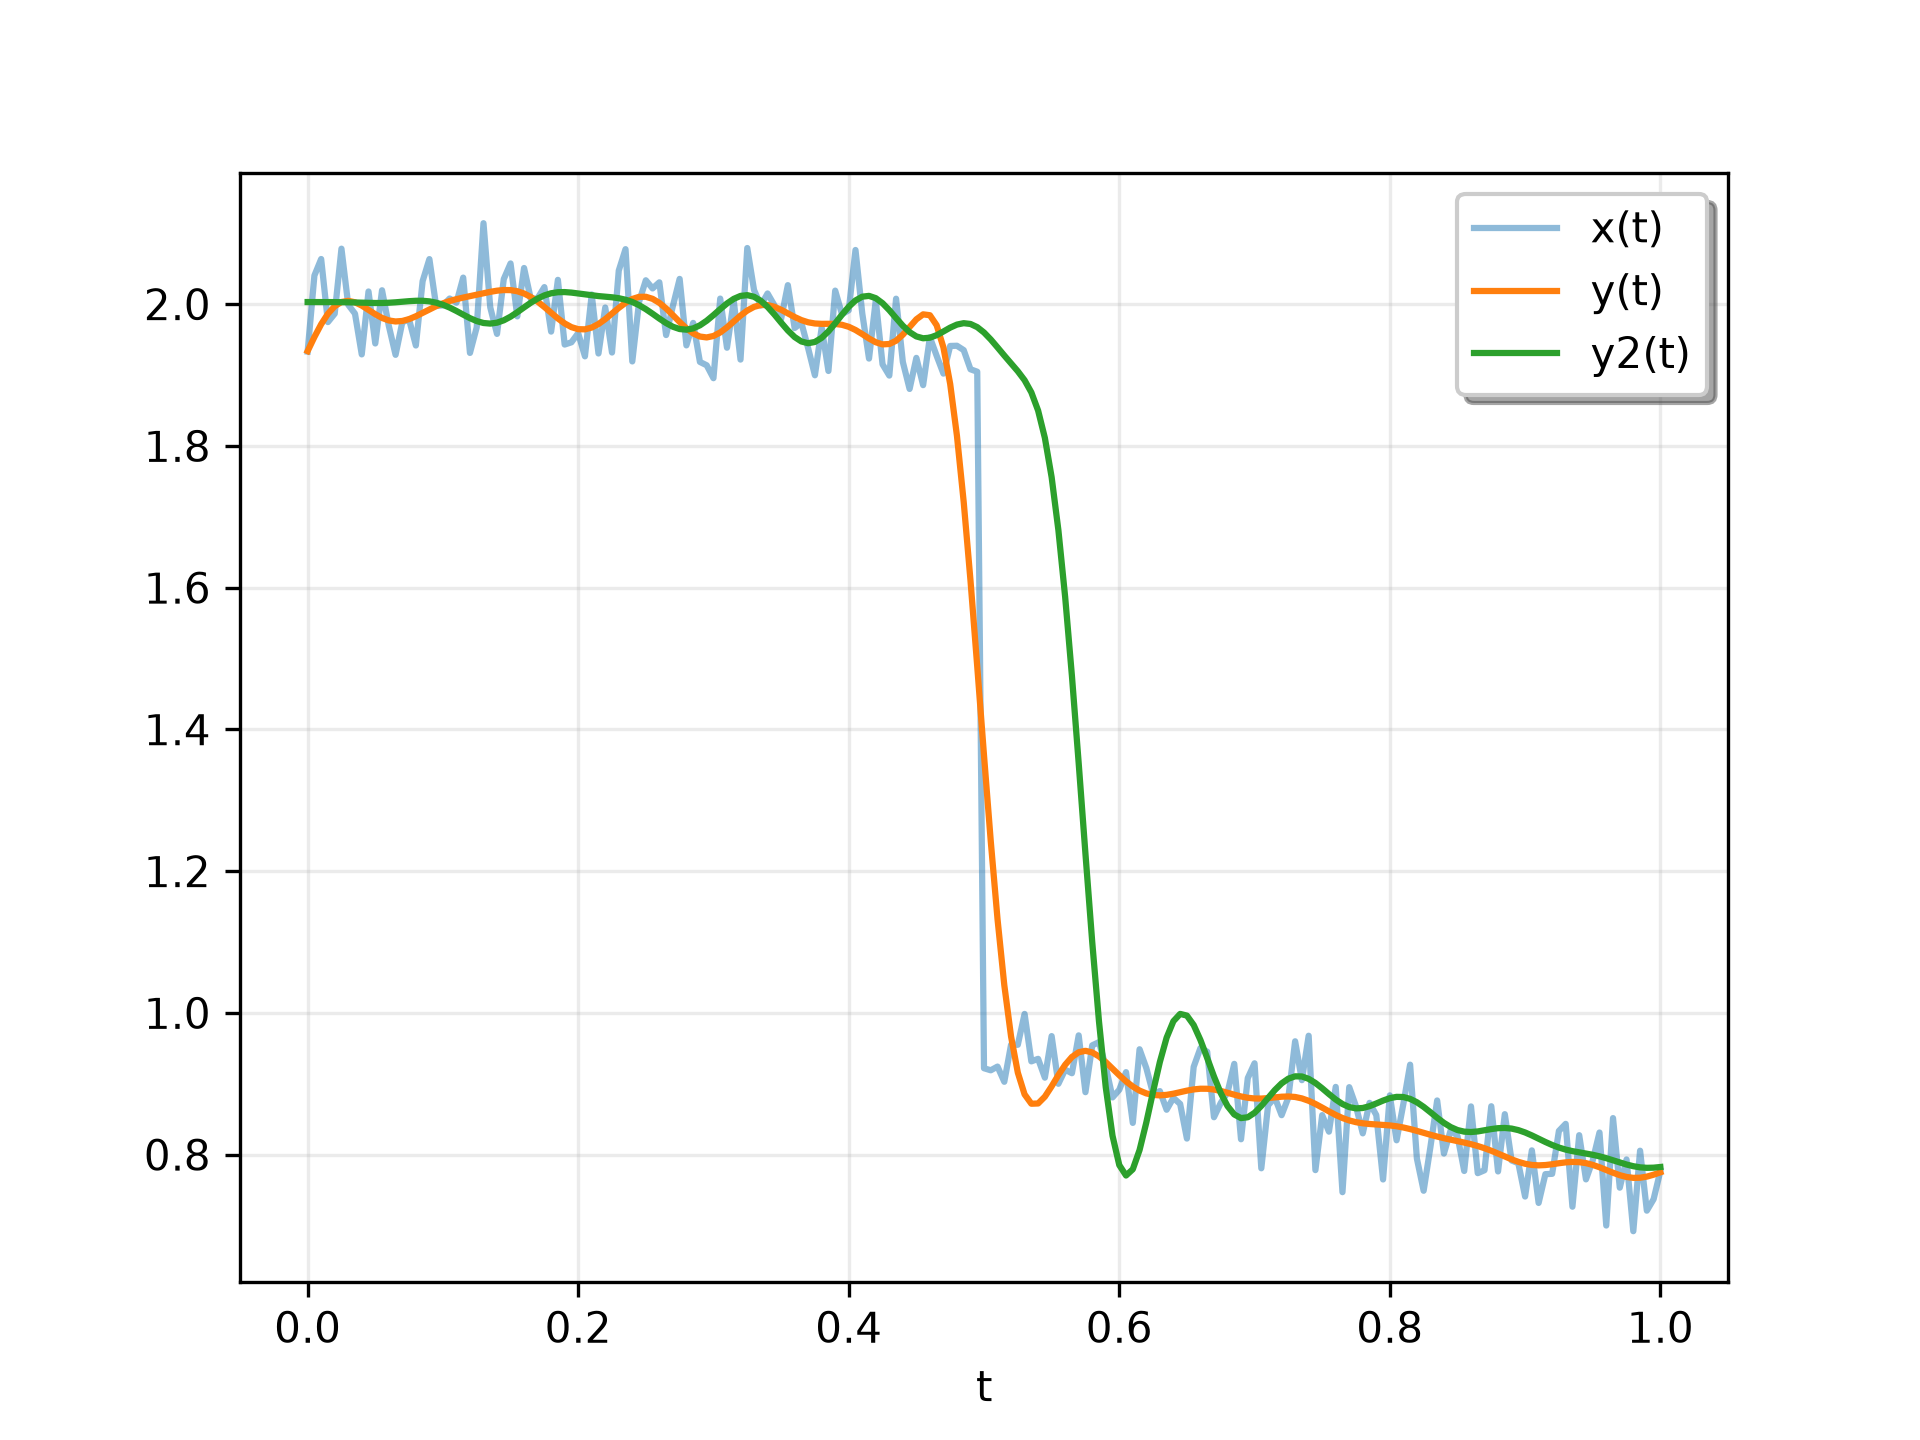
plt.plot(t, x, alpha=0.5, label='x(t)')
plt.plot(t, y, label='y(t)')
plt.plot(t, y2, label='y2(t)')
plt.legend(framealpha=1, shadow=True)
✗
<matplotlib.legend.Legend object at 0x7f3f687d8d70>
plt.grid(alpha=0.25)
✓plt.xlabel('t')
✗Text(0.5, 0, 't')
plt.show()
✓
See also
Aliases
scipy.signal.sosfiltfilt