bundles / scipy 2.0.0.dev0+git20260907.41eeb59 / scipy / signal / _signaltools / sosfilt
function
scipy.signal._signaltools:sosfilt
source: build-install/usr/lib/python3.14/site-packages/scipy/signal/_signaltools.py:5146
Signature
def sosfilt(sos, x, axis = -1, zi = None)Summary
Filter data along one dimension using cascaded second-order sections.
Extended Summary
Filter a data sequence, x, using a digital IIR filter defined by sos.
Parameters
sos: array_likeArray of second-order filter coefficients, must have shape
(n_sections, 6). Each row corresponds to a second-order section, with the first three columns providing the numerator coefficients and the last three providing the denominator coefficients.x: array_likeAn N-dimensional input array.
axis: int, optionalThe axis of the input data array along which to apply the linear filter. The filter is applied to each subarray along this axis. Default is -1.
zi: array_like, optionalInitial conditions for the cascaded filter delays. It is a (at least 2D) vector of shape
(n_sections, ..., 2, ...), where..., 2, ...denotes the shape ofx, but withx.shape[axis]replaced by 2. Ifziis None or is not given then initial rest (i.e. all zeros) is assumed. Note that these initial conditions are not the same as the initial conditions given by lfiltic or lfilter_zi.
Returns
y: ndarrayThe output of the digital filter.
zf: ndarray, optionalIf
ziis None, this is not returned, otherwise, zf holds the final filter delay values.
Notes
The filter function is implemented as a series of second-order filters with direct-form II transposed structure. It is designed to minimize numerical precision errors for high-order filters.
Examples
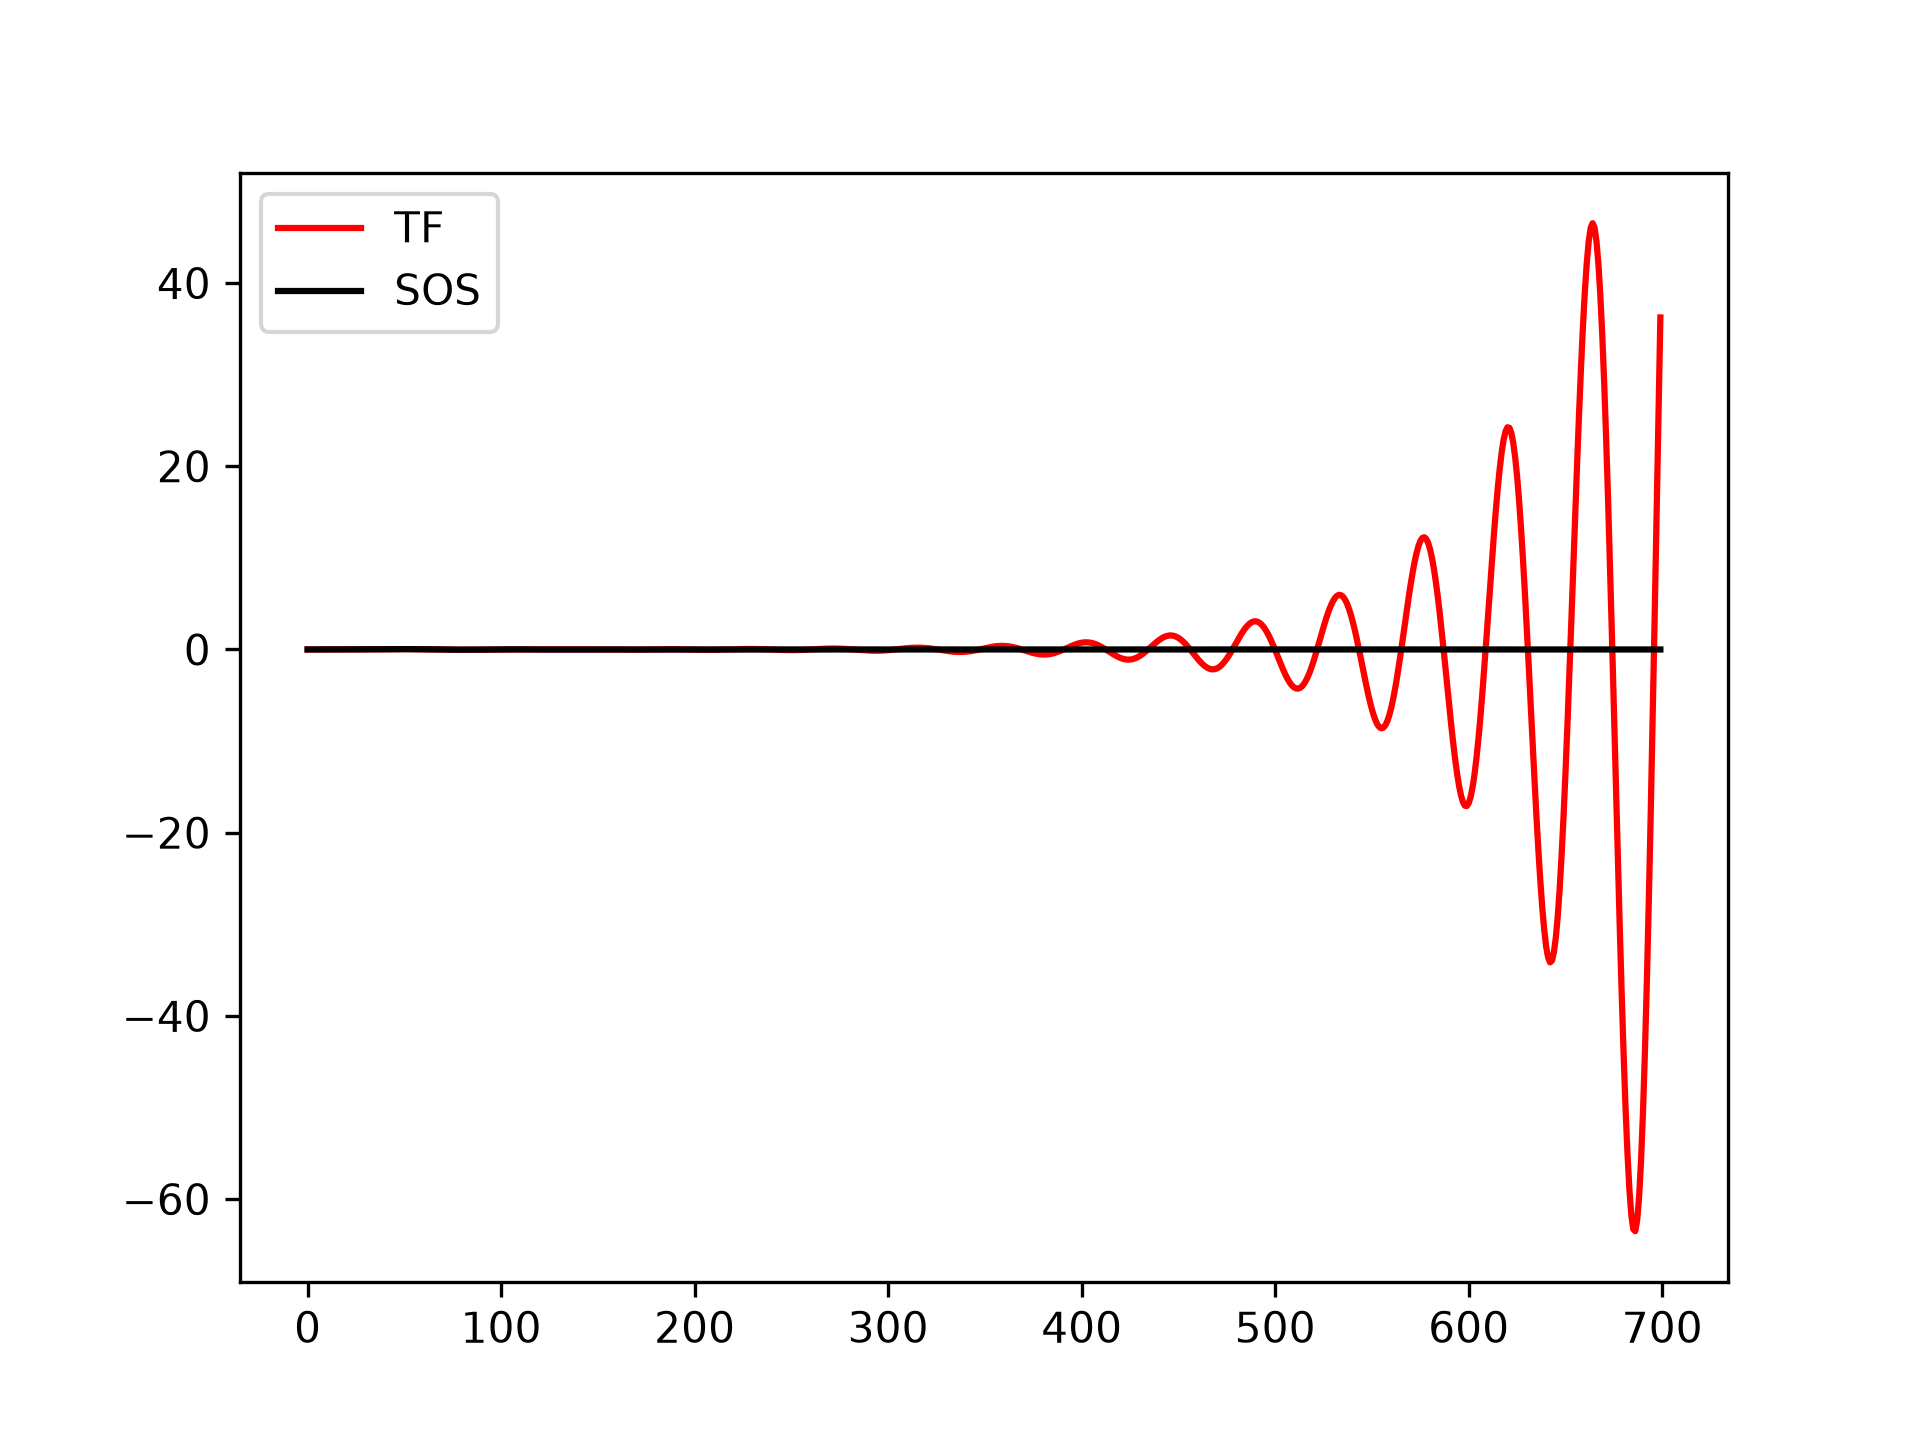
Plot a 13th-order filter's impulse response using both `lfilter` and `sosfilt`, showing the instability that results from trying to do a 13th-order filter in a single stage (the numerical error pushes some poles outside of the unit circle):import matplotlib.pyplot as plt from scipy import signal b, a = signal.ellip(13, 0.009, 80, 0.05, output='ba') sos = signal.ellip(13, 0.009, 80, 0.05, output='sos') x = signal.unit_impulse(700) y_tf = signal.lfilter(b, a, x) y_sos = signal.sosfilt(sos, x)✓
plt.plot(y_tf, 'r', label='TF')
plt.plot(y_sos, 'k', label='SOS')
plt.legend(loc='best')
✗
<matplotlib.legend.Legend object at 0x7f3f600cae40>
plt.show()
✓
See also
Aliases
scipy.signal.sosfilt