bundles / scipy 2.0.0.dev0+git20260907.41eeb59 / scipy / stats / _morestats / probplot
function
scipy.stats._morestats:probplot
source: build-install/usr/lib/python3.14/site-packages/scipy/stats/_morestats.py:536
Signature
def probplot(x, sparams = (), dist = norm, fit = True, plot = None, rvalue = False)Summary
Calculate quantiles for a probability plot, and optionally show the plot.
Extended Summary
Generates a probability plot of sample data against the quantiles of a specified theoretical distribution (the normal distribution by default). probplot optionally calculates a best-fit line for the data and plots the results using Matplotlib or a given plot function.
Parameters
x: array_likeSample/response data from which probplot creates the plot.
sparams: tuple, optionalDistribution-specific shape parameters (shape parameters plus location and scale).
dist: str or stats.distributions instance, optionalDistribution or distribution function name. The default is 'norm' for a normal probability plot. Objects that look enough like a stats.distributions instance (i.e. they have a
ppfmethod) are also accepted.fit: bool, optionalFit a least-squares regression (best-fit) line to the sample data if True (default).
plot: object, optionalIf given, plots the quantiles. If given and
fitis True, also plots the least squares fit.plotis an object that has to have methods "plot" and "text". The matplotlib.pyplot module or a Matplotlib Axes object can be used, or a custom object with the same methods. Default is None, which means that no plot is created.rvalue: bool, optionalIf
plotis provided andfitis True, settingrvalueto True includes the coefficient of determination on the plot. Default is False.
Returns
(osm, osr): tuple of ndarraysTuple of theoretical quantiles (osm, or order statistic medians) and ordered responses (osr).
osris simply sorted inputx. For details on howosmis calculated see the Notes section.(slope, intercept, r): tuple of floats, optionalTuple containing the result of the least-squares fit, if that is performed by probplot.
ris the square root of the coefficient of determination. Iffit=Falseandplot=None, this tuple is not returned.
Notes
Even if plot is given, the figure is not shown or saved by probplot; plt.show() or plt.savefig('figname.png') should be used after calling probplot.
probplot generates a probability plot, which should not be confused with a Q-Q or a P-P plot. Statsmodels has more extensive functionality of this type, see statsmodels.api.ProbPlot.
The formula used for the theoretical quantiles (horizontal axis of the probability plot) is Filliben's estimate
quantiles = dist.ppf(val), for

        0.5**(1/n),                  for i = n
  val = (i - 0.3175) / (n + 0.365),  for i = 2, ..., n-1
        1 - 0.5**(1/n),              for i = 1
where i indicates the i-th ordered value and n is the total number of values.
Examples
import numpy as np
from scipy import stats
import matplotlib.pyplot as plt
nsample = 100
rng = np.random.default_rng()
✓
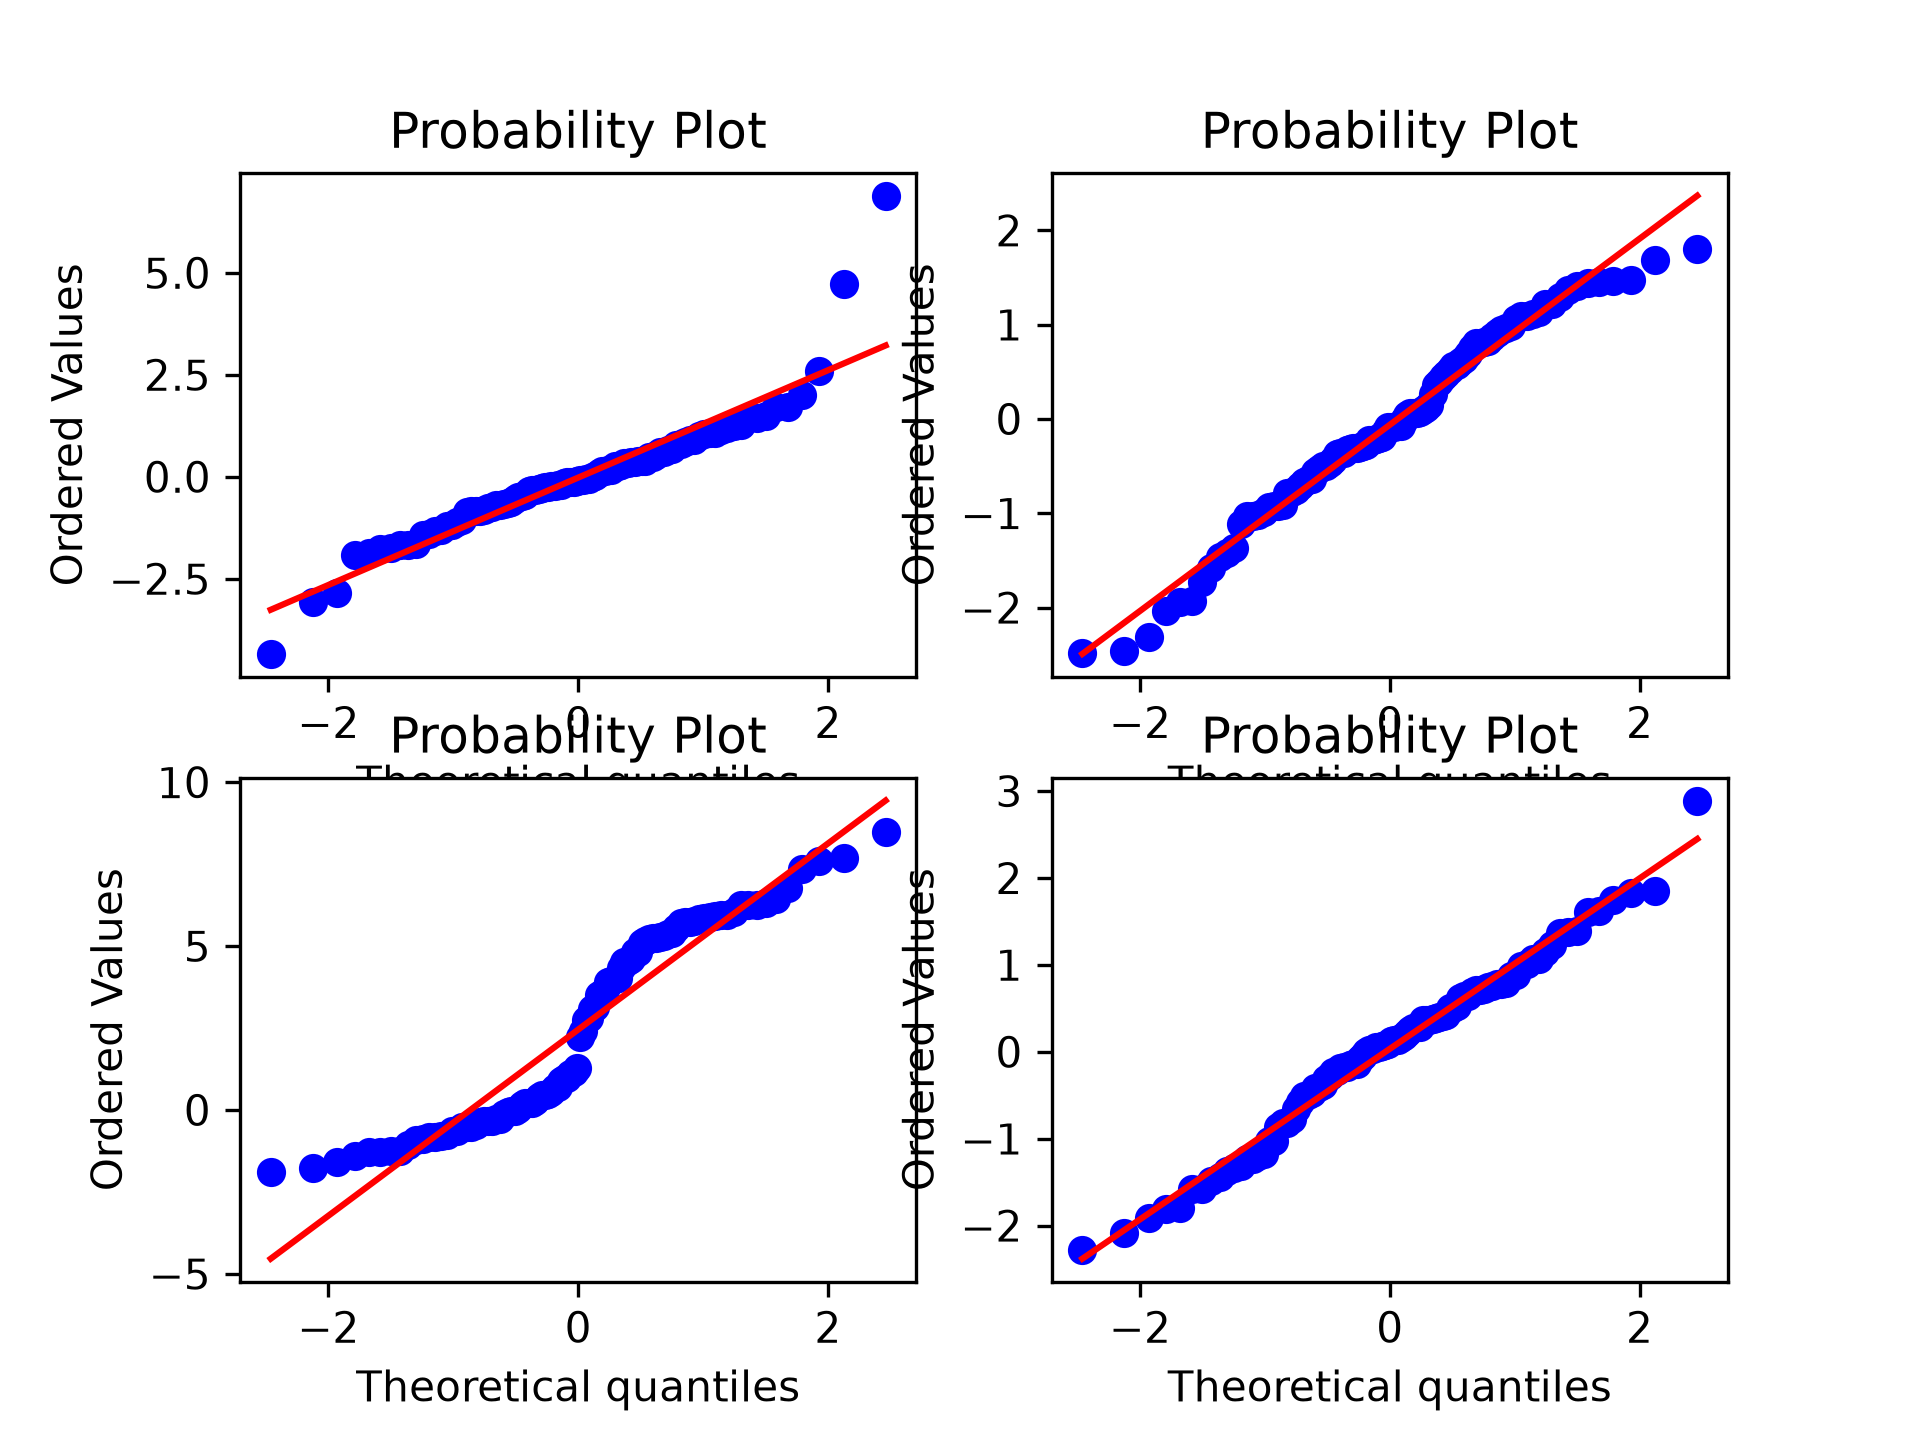
ax1 = plt.subplot(221)
x = stats.t.rvs(3, size=nsample, random_state=rng)
res = stats.probplot(x, plot=plt)
✓
ax2 = plt.subplot(222)
x = stats.t.rvs(25, size=nsample, random_state=rng)
res = stats.probplot(x, plot=plt)
✓
ax3 = plt.subplot(223)
x = stats.norm.rvs(loc=[0,5], scale=[1,1.5],
                   size=(nsample//2,2), random_state=rng).ravel()
res = stats.probplot(x, plot=plt)
✓
ax4 = plt.subplot(224)
x = stats.norm.rvs(loc=0, scale=1, size=nsample, random_state=rng)
res = stats.probplot(x, plot=plt)
✓
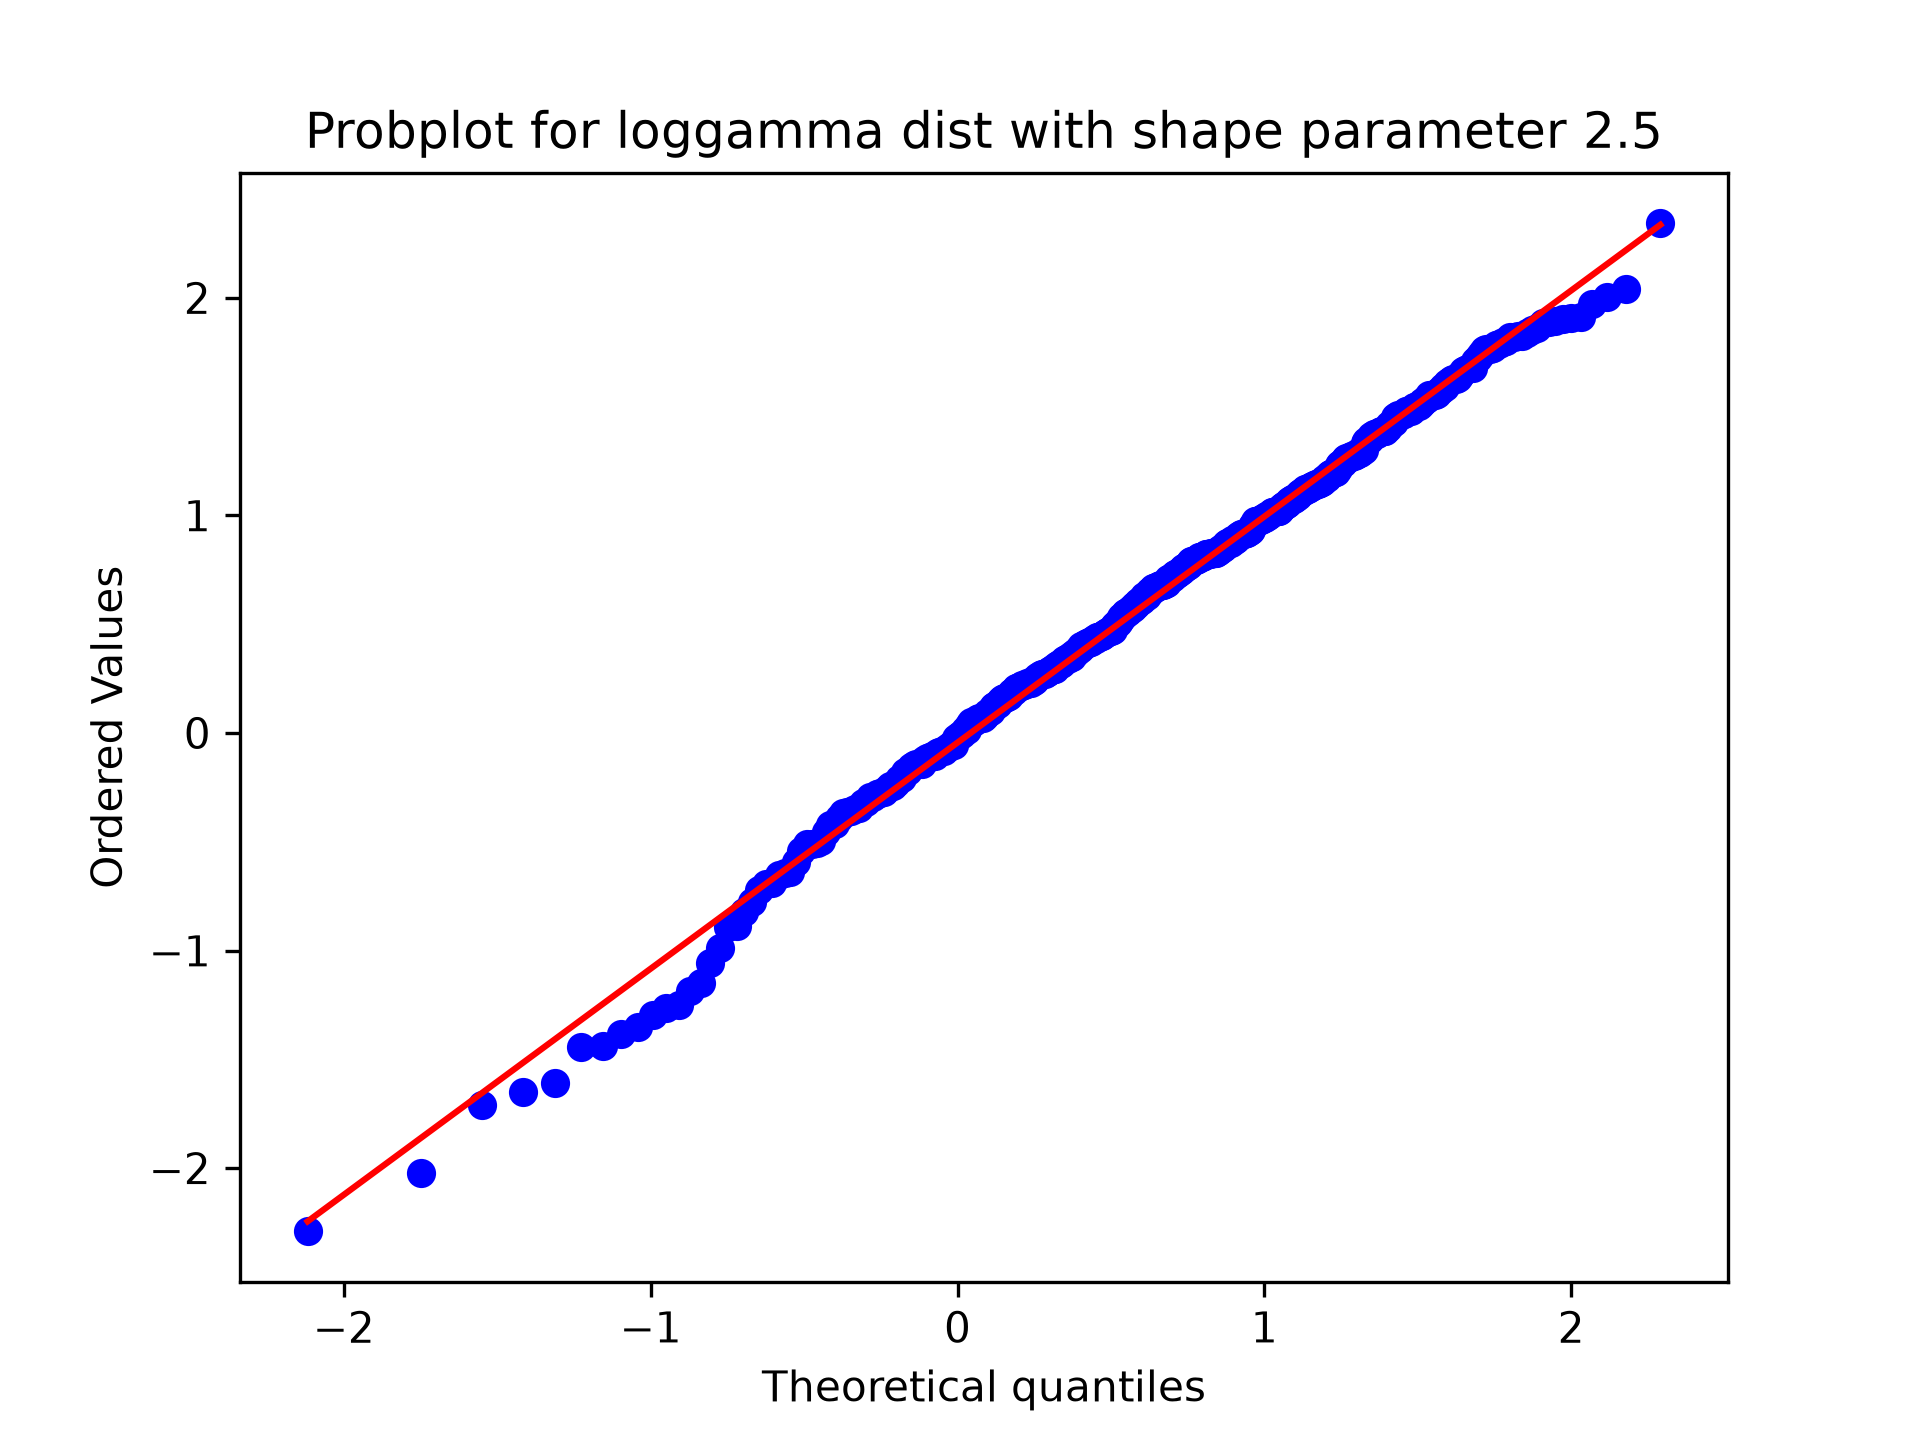
fig = plt.figure()
ax = fig.add_subplot(111)
x = stats.loggamma.rvs(c=2.5, size=500, random_state=rng)
res = stats.probplot(x, dist=stats.loggamma, sparams=(2.5,), plot=ax)
✓
ax.set_title("Probplot for loggamma dist with shape parameter 2.5")
✗Text(0.5, 1.0, 'Probplot for loggamma dist with shape parameter 2.5')Show the results with Matplotlib:
plt.show()
✓
Aliases
scipy.stats.probplot