bundles / scipy 2.0.0.dev0+git20260907.41eeb59 / scipy / stats / _morestats / yeojohnson_llf
function
scipy.stats._morestats:yeojohnson_llf
source: build-install/usr/lib/python3.14/site-packages/scipy/stats/_morestats.py:1759
Signature
def yeojohnson_llf(lmb, data, *, axis = 0, nan_policy = propagate, keepdims = False)Summary
The Yeo-Johnson log-likelihood function.
Parameters
lmb: scalarParameter for Yeo-Johnson transformation. See yeojohnson for details.
data: array_likeData to calculate Yeo-Johnson log-likelihood for.
axis: int, default: 0If an int, the axis of the input along which to compute the statistic. The statistic of each axis-slice (e.g. row) of the input will appear in a corresponding element of the output. If
None, the input will be raveled before computing the statistic.nan_policy: {'propagate', 'omit', 'raise'Defines how to handle input NaNs.
propagate: if a NaN is present in the axis slice (e.g. row) along which the statistic is computed, the corresponding entry of the output will be NaN.omit: NaNs will be omitted when performing the calculation. If insufficient data remains in the axis slice along which the statistic is computed, the corresponding entry of the output will be NaN.raise: if a NaN is present, aValueErrorwill be raised.
keepdims: bool, default: FalseIf this is set to True, the axes which are reduced are left in the result as dimensions with size one. With this option, the result will broadcast correctly against the input array.
Returns
llf: floatYeo-Johnson log-likelihood of
datagivenlmb.
Notes
The Yeo-Johnson log-likelihood function is defined here as
where is the number of data points = data and is the estimated variance of the Yeo-Johnson transformed input data . This corresponds to the profile log-likelihood of the original data with some constant terms dropped.
Examples
import numpy as np
from scipy import stats
import matplotlib.pyplot as plt
from mpl_toolkits.axes_grid1.inset_locator import inset_axes
✓
x = stats.loggamma.rvs(5, loc=10, size=1000)
lmbdas = np.linspace(-2, 10)
llf = np.zeros(lmbdas.shape, dtype=float)
for ii, lmbda in enumerate(lmbdas):
    llf[ii] = stats.yeojohnson_llf(lmbda, x)
✓
x_most_normal, lmbda_optimal = stats.yeojohnson(x)
✓fig = plt.figure() ax = fig.add_subplot(111)✓
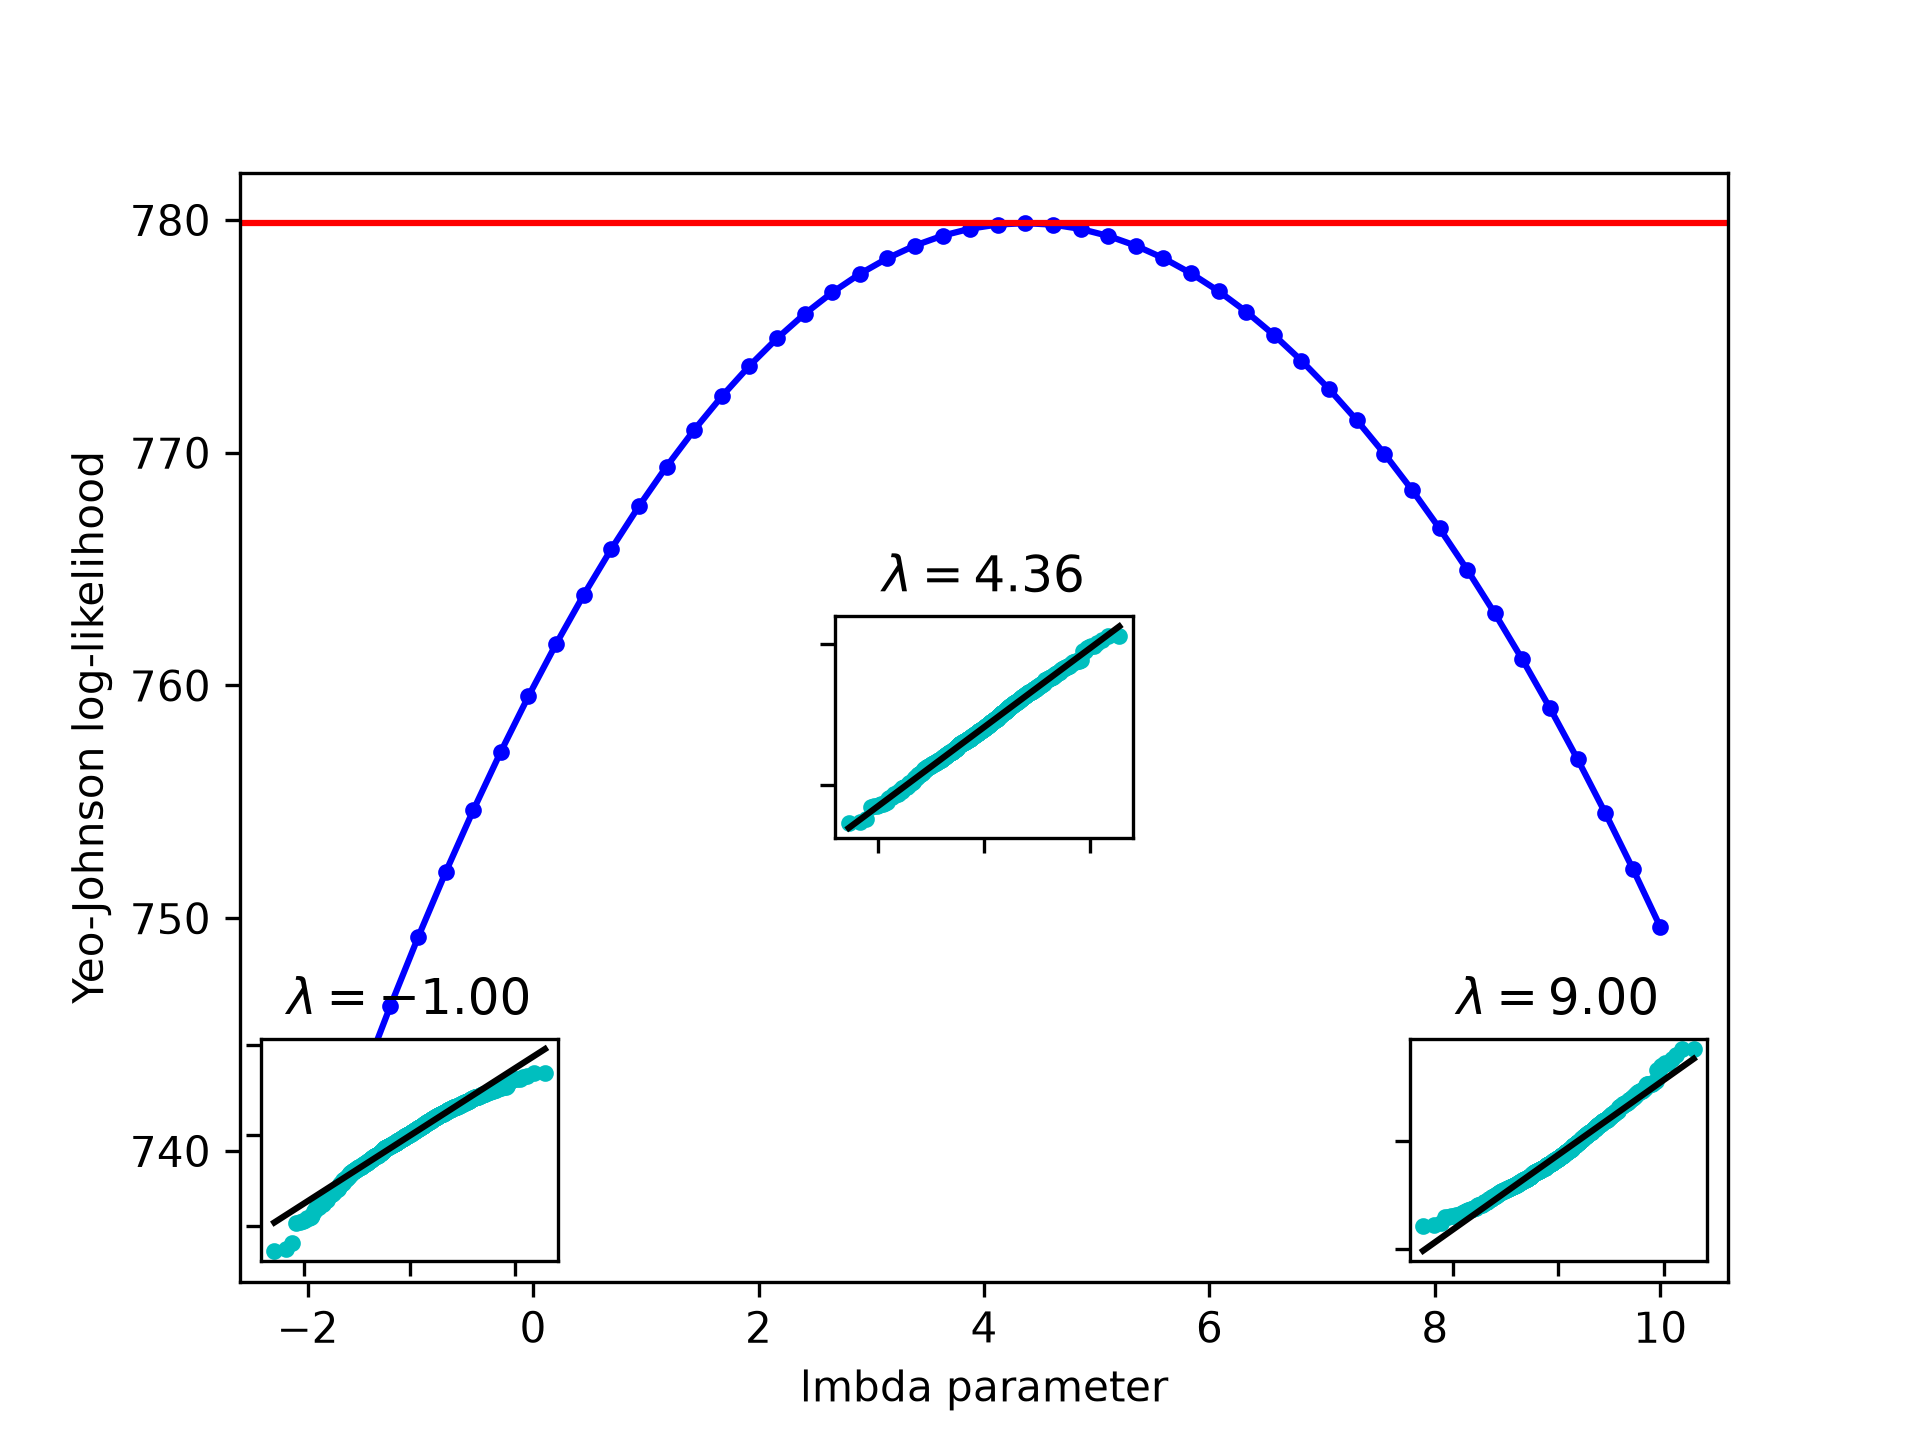
ax.plot(lmbdas, llf, 'b.-')
ax.axhline(stats.yeojohnson_llf(lmbda_optimal, x), color='r')
ax.set_xlabel('lmbda parameter')
ax.set_ylabel('Yeo-Johnson log-likelihood')
✗
Text(0, 0.5, 'Yeo-Johnson log-likelihood')Now add some probability plots to show that where the log-likelihood is maximized the data transformed with `yeojohnson` looks closest to normal:
locs = [3, 10, 4] # 'lower left', 'center', 'lower right'
✓for lmbda, loc in zip([-1, lmbda_optimal, 9], locs): xt = stats.yeojohnson(x, lmbda=lmbda) (osm, osr), (slope, intercept, r_sq) = stats.probplot(xt) ax_inset = inset_axes(ax, width="20%", height="20%", loc=loc) ax_inset.plot(osm, osr, 'c.', osm, slope*osm + intercept, 'k-') ax_inset.set_xticklabels([]) ax_inset.set_yticklabels([]) ax_inset.set_title(r'$\lambda=%1.2f$' % lmbda)✗
[<matplotlib.lines.Line2D object at 0x7f3f68fd8440>, <matplotlib.lines.Line2D object at 0x7f3f68fd8d70>]
[Text(-4.0, 0, ''), Text(-3.0, 0, ''), Text(-2.0, 0, ''), Text(-1.0, 0, ''), Text(0.0, 0, ''), Text(1.0, 0, ''), Text(2.0, 0, ''), Text(3.0, 0, ''), Text(4.0, 0, '')]
[Text(0, 0.905, ''), Text(0, 0.91, ''), Text(0, 0.915, ''), Text(0, 0.92, ''), Text(0, 0.925, ''), Text(0, 0.93, ''), Text(0, 0.935, '')]
Text(0.5, 1.0, '$\\lambda=-1.00$')
[<matplotlib.lines.Line2D object at 0x7f3f607946e0>, <matplotlib.lines.Line2D object at 0x7f3f60795010>]
[Text(-4.0, 0, ''), Text(-3.0, 0, ''), Text(-2.0, 0, ''), Text(-1.0, 0, ''), Text(0.0, 0, ''), Text(1.0, 0, ''), Text(2.0, 0, ''), Text(3.0, 0, ''), Text(4.0, 0, '')]
[Text(0, 6000.0, ''), Text(0, 8000.0, ''), Text(0, 10000.0, ''), Text(0, 12000.0, ''), Text(0, 14000.0, ''), Text(0, 16000.0, ''), Text(0, 18000.0, ''), Text(0, 20000.0, ''), Text(0, 22000.0, '')]
Text(0.5, 1.0, '$\\lambda=4.36$')
[<matplotlib.lines.Line2D object at 0x7f3f58a881a0>, <matplotlib.lines.Line2D object at 0x7f3f58a88440>]
[Text(-4.0, 0, ''), Text(-3.0, 0, ''), Text(-2.0, 0, ''), Text(-1.0, 0, ''), Text(0.0, 0, ''), Text(1.0, 0, ''), Text(2.0, 0, ''), Text(3.0, 0, ''), Text(4.0, 0, '')]
[Text(0, -250000000.0, ''), Text(0, 0.0, ''), Text(0, 250000000.0, ''), Text(0, 500000000.0, ''), Text(0, 750000000.0, ''), Text(0, 1000000000.0, ''), Text(0, 1250000000.0, ''), Text(0, 1500000000.0, ''), Text(0, 1750000000.0, ''), Text(0, 2000000000.0, '')]
Text(0.5, 1.0, '$\\lambda=9.00$')
plt.show()
✓
See also
Aliases
scipy.stats.yeojohnson_llf