bundles / scipy 2.0.0.dev0+git20260907.41eeb59 / scipy / stats / _morestats / yeojohnson
function
scipy.stats._morestats:yeojohnson
source: build-install/usr/lib/python3.14/site-packages/scipy/stats/_morestats.py:1613
Signature
def yeojohnson(x, lmbda = None, *, nan_policy = propagate)Summary
Return a dataset transformed by a Yeo-Johnson power transformation.
Parameters
x: ndarrayInput array. Should be 1-dimensional.
lmbda: float, optionalIf
lmbdaisNone, find the lambda that maximizes the log-likelihood function and return it as the second output argument. Otherwise the transformation is done for the given value.nan_policy: {'propagate', 'omit', 'raise'}Defines how to handle NaNs in
x.propagate: if a NaN is present, all outputs will contain NaNs.omit: NaNs will be omitted when calculating the optimal maxlog;NaNs in
xwill remain NaNs in the transformed data.
raise: if a NaN is present, aValueErrorwill be raised.
Returns
: yeojohnson: ndarrayYeo-Johnson power transformed array.
maxlog: float, optionalIf the
lmbdaparameter is None, the second returned argument is the lambda that maximizes the log-likelihood function.
Notes
The Yeo-Johnson transform is given by:
Unlike boxcox, yeojohnson does not require the input data to be positive.
Examples
from scipy import stats
import matplotlib.pyplot as plt
✓
fig = plt.figure()
ax1 = fig.add_subplot(211)
x = stats.loggamma.rvs(5, size=500) + 5
prob = stats.probplot(x, dist=stats.norm, plot=ax1)
✓
ax1.set_xlabel('')
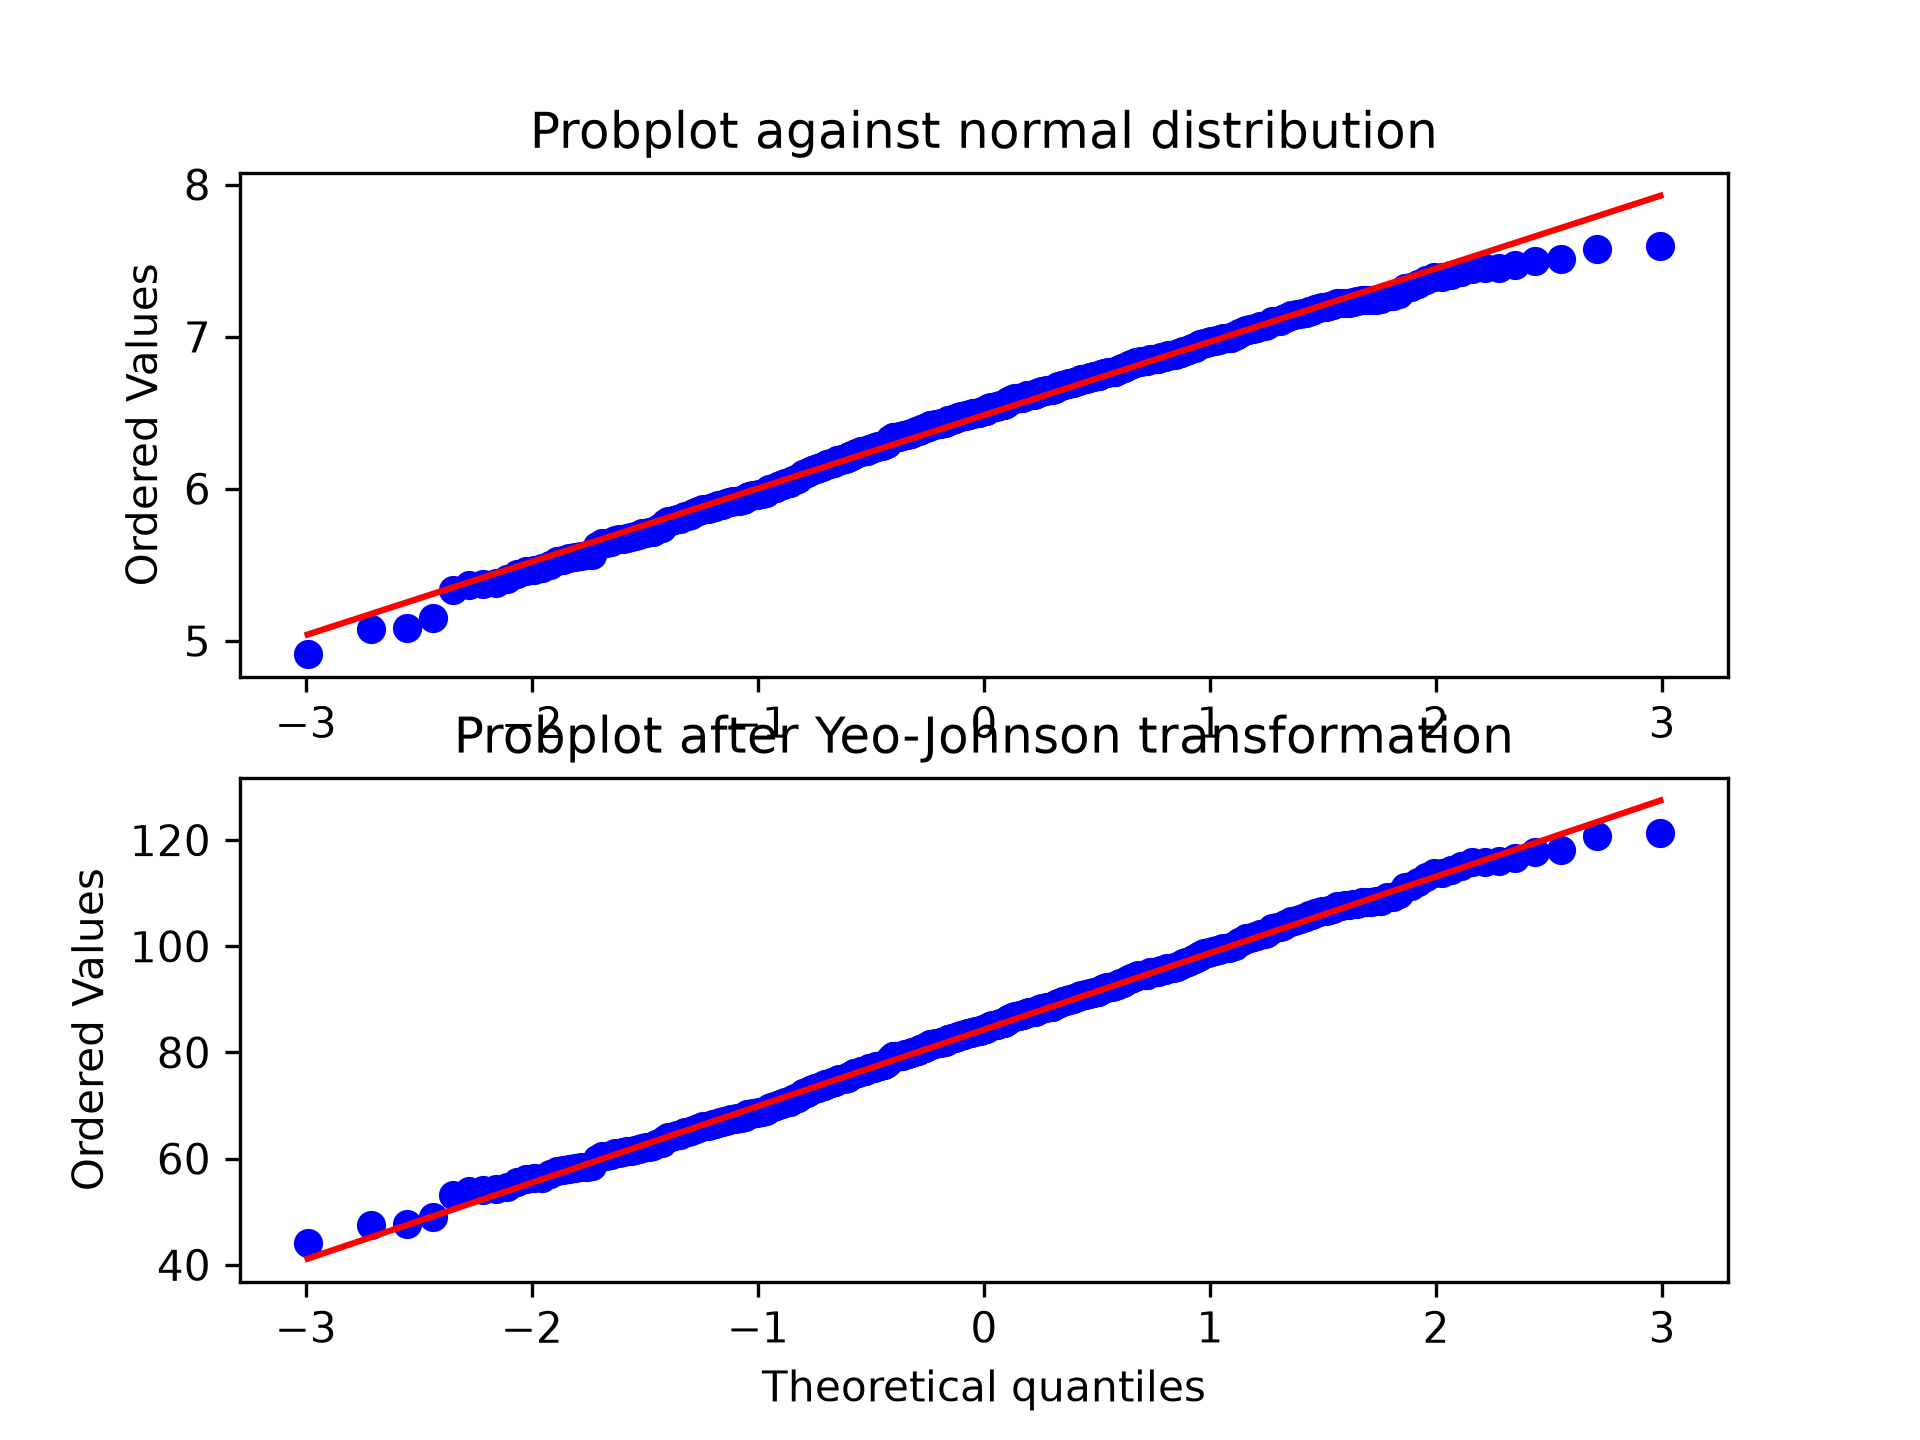
ax1.set_title('Probplot against normal distribution')
✗
Text(0.5, 1.0, 'Probplot against normal distribution')We now use `yeojohnson` to transform the data so it's closest to normal:
ax2 = fig.add_subplot(212)
xt, lmbda = stats.yeojohnson(x)
prob = stats.probplot(xt, dist=stats.norm, plot=ax2)
✓
ax2.set_title('Probplot after Yeo-Johnson transformation')
✗Text(0.5, 1.0, 'Probplot after Yeo-Johnson transformation')
plt.show()
✓
See also
Aliases
scipy.stats.yeojohnson