bundles / scipy latest / scipy / signal / _czt / czt_points
function
scipy.signal._czt:czt_points
source: /scipy/signal/_czt.py :53
Signature
def czt_points ( m , w = None , a = (1+0j) ) Summary
Return the points at which the chirp z-transform is computed.
Parameters
m: intThe number of points desired.
w: complex, optionalThe ratio between points in each step. Defaults to equally spaced points around the entire unit circle.
a: complex, optionalThe starting point in the complex plane. Default is 1+0j.
Returns
out: ndarrayThe points in the Z plane at which CZT samples the z-transform, when called with arguments
m,w, anda, as complex numbers.
Notes
Array API Standard Support
czt_points has experimental support for Python Array API Standard compatible backends in addition to NumPy. Please consider testing these features by setting an environment variable SCIPY_ARRAY_API=1 and providing CuPy, PyTorch, JAX, or Dask arrays as array arguments. The following combinations of backend and device (or other capability) are supported.
====================  ====================  ====================
Library               CPU                   GPU
====================  ====================  ====================
NumPy                 ✅                     n/a
CuPy                  n/a                   ⛔
PyTorch               ⛔                     ⛔
JAX                   ⛔                     ⛔
Dask                  ⛔                     n/a
====================  ====================  ====================
See
dev-arrayapifor more information.
Examples
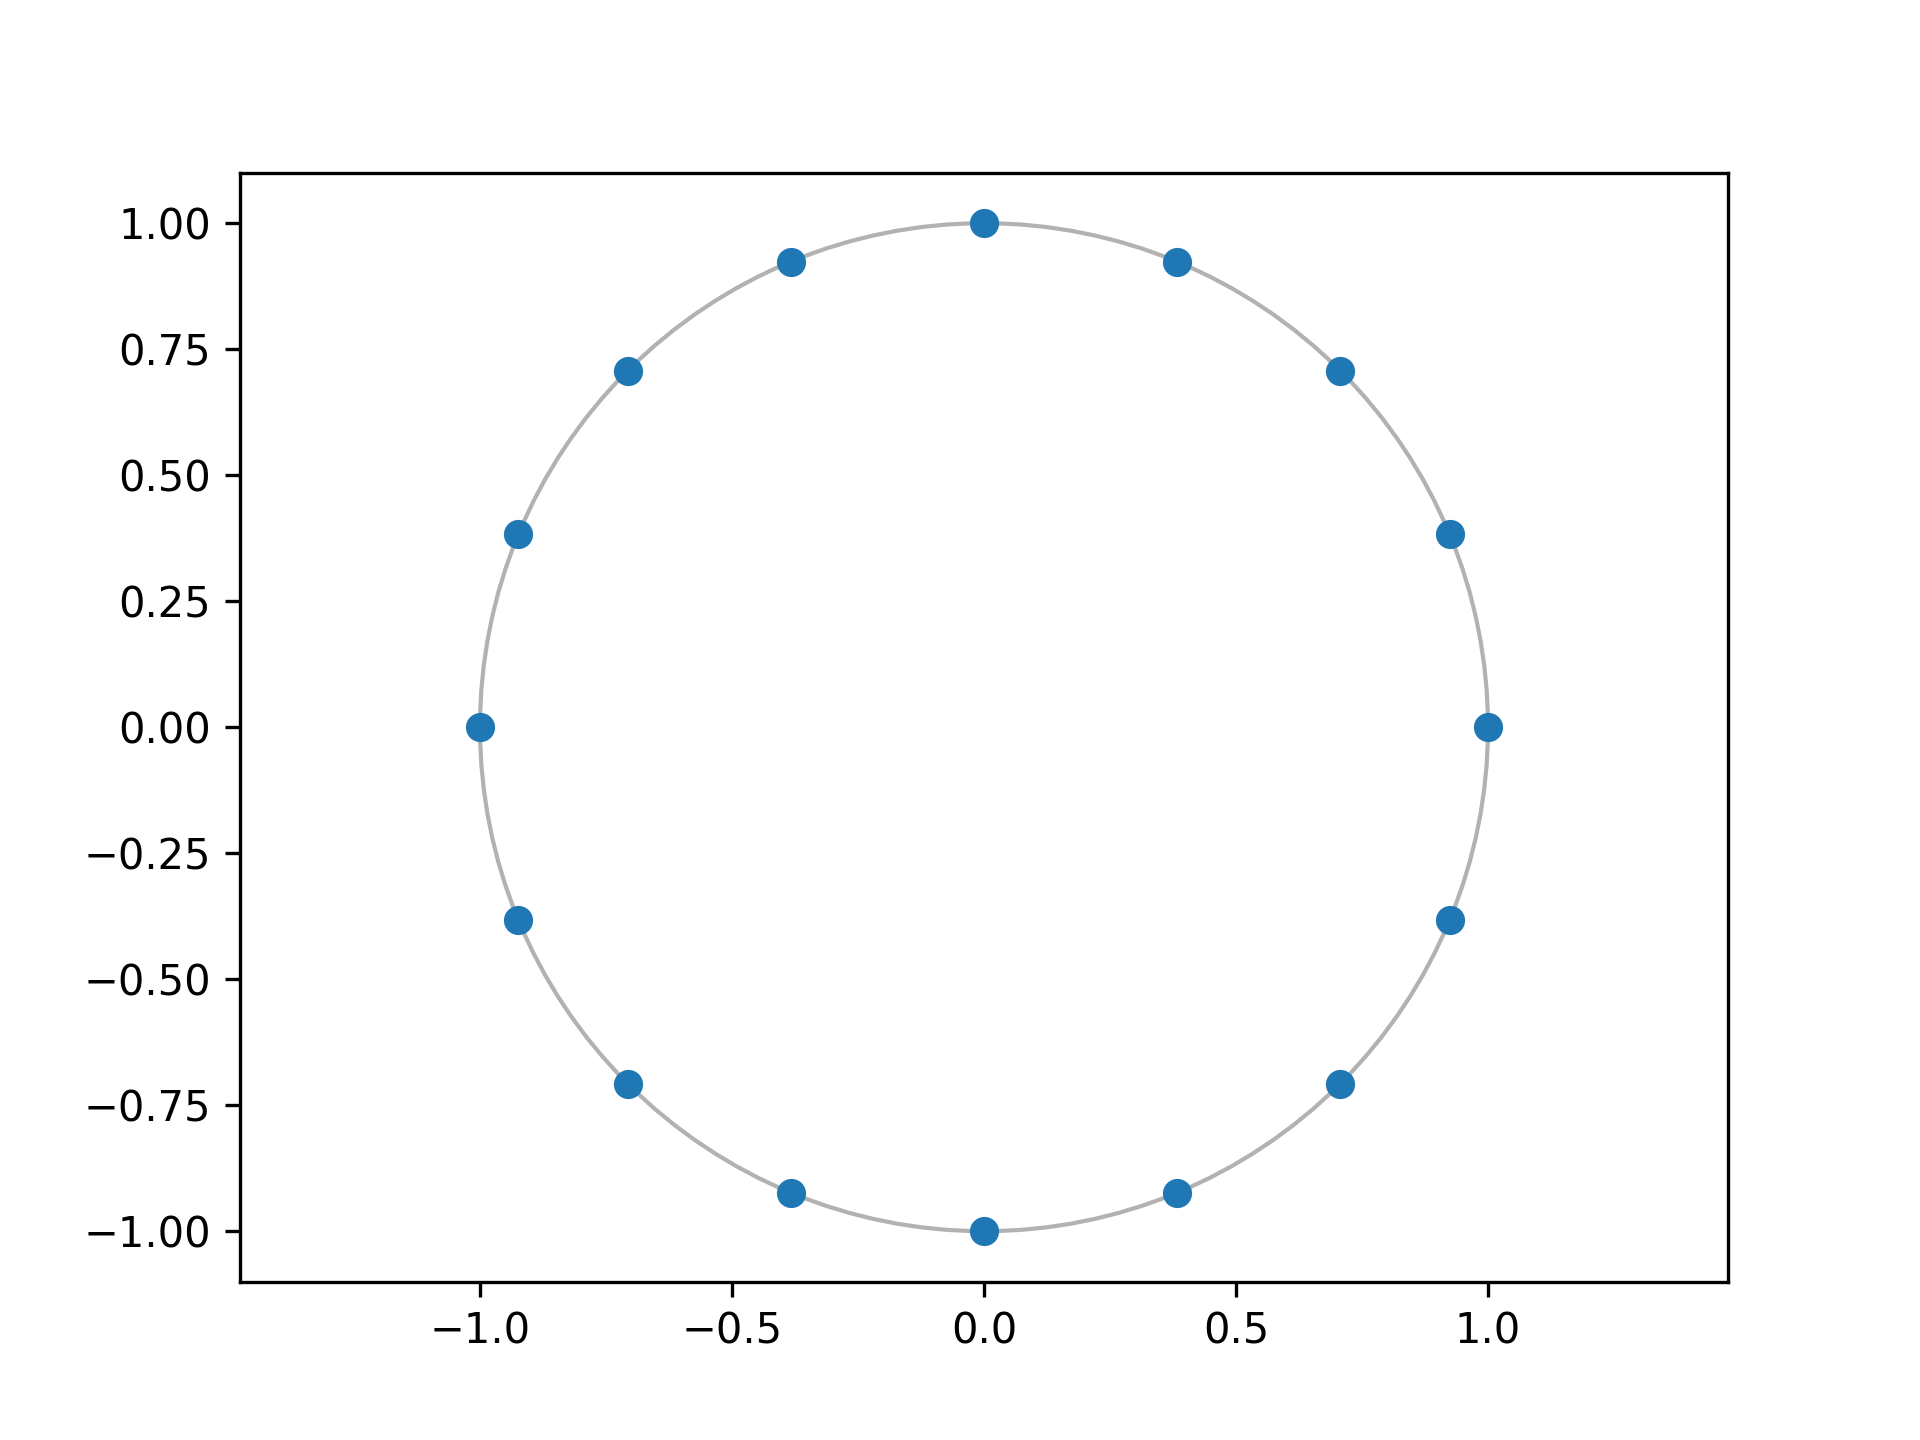
Plot the points of a 16-point FFT:import numpy as np from scipy.signal import czt_points points = czt_points(16) import matplotlib.pyplot as plt✓
plt.plot(points.real, points.imag, 'o')
plt.gca().add_patch(plt.Circle((0,0), radius=1, fill=False, alpha=.3))
plt.axis('equal')
✗
plt.show()
✓
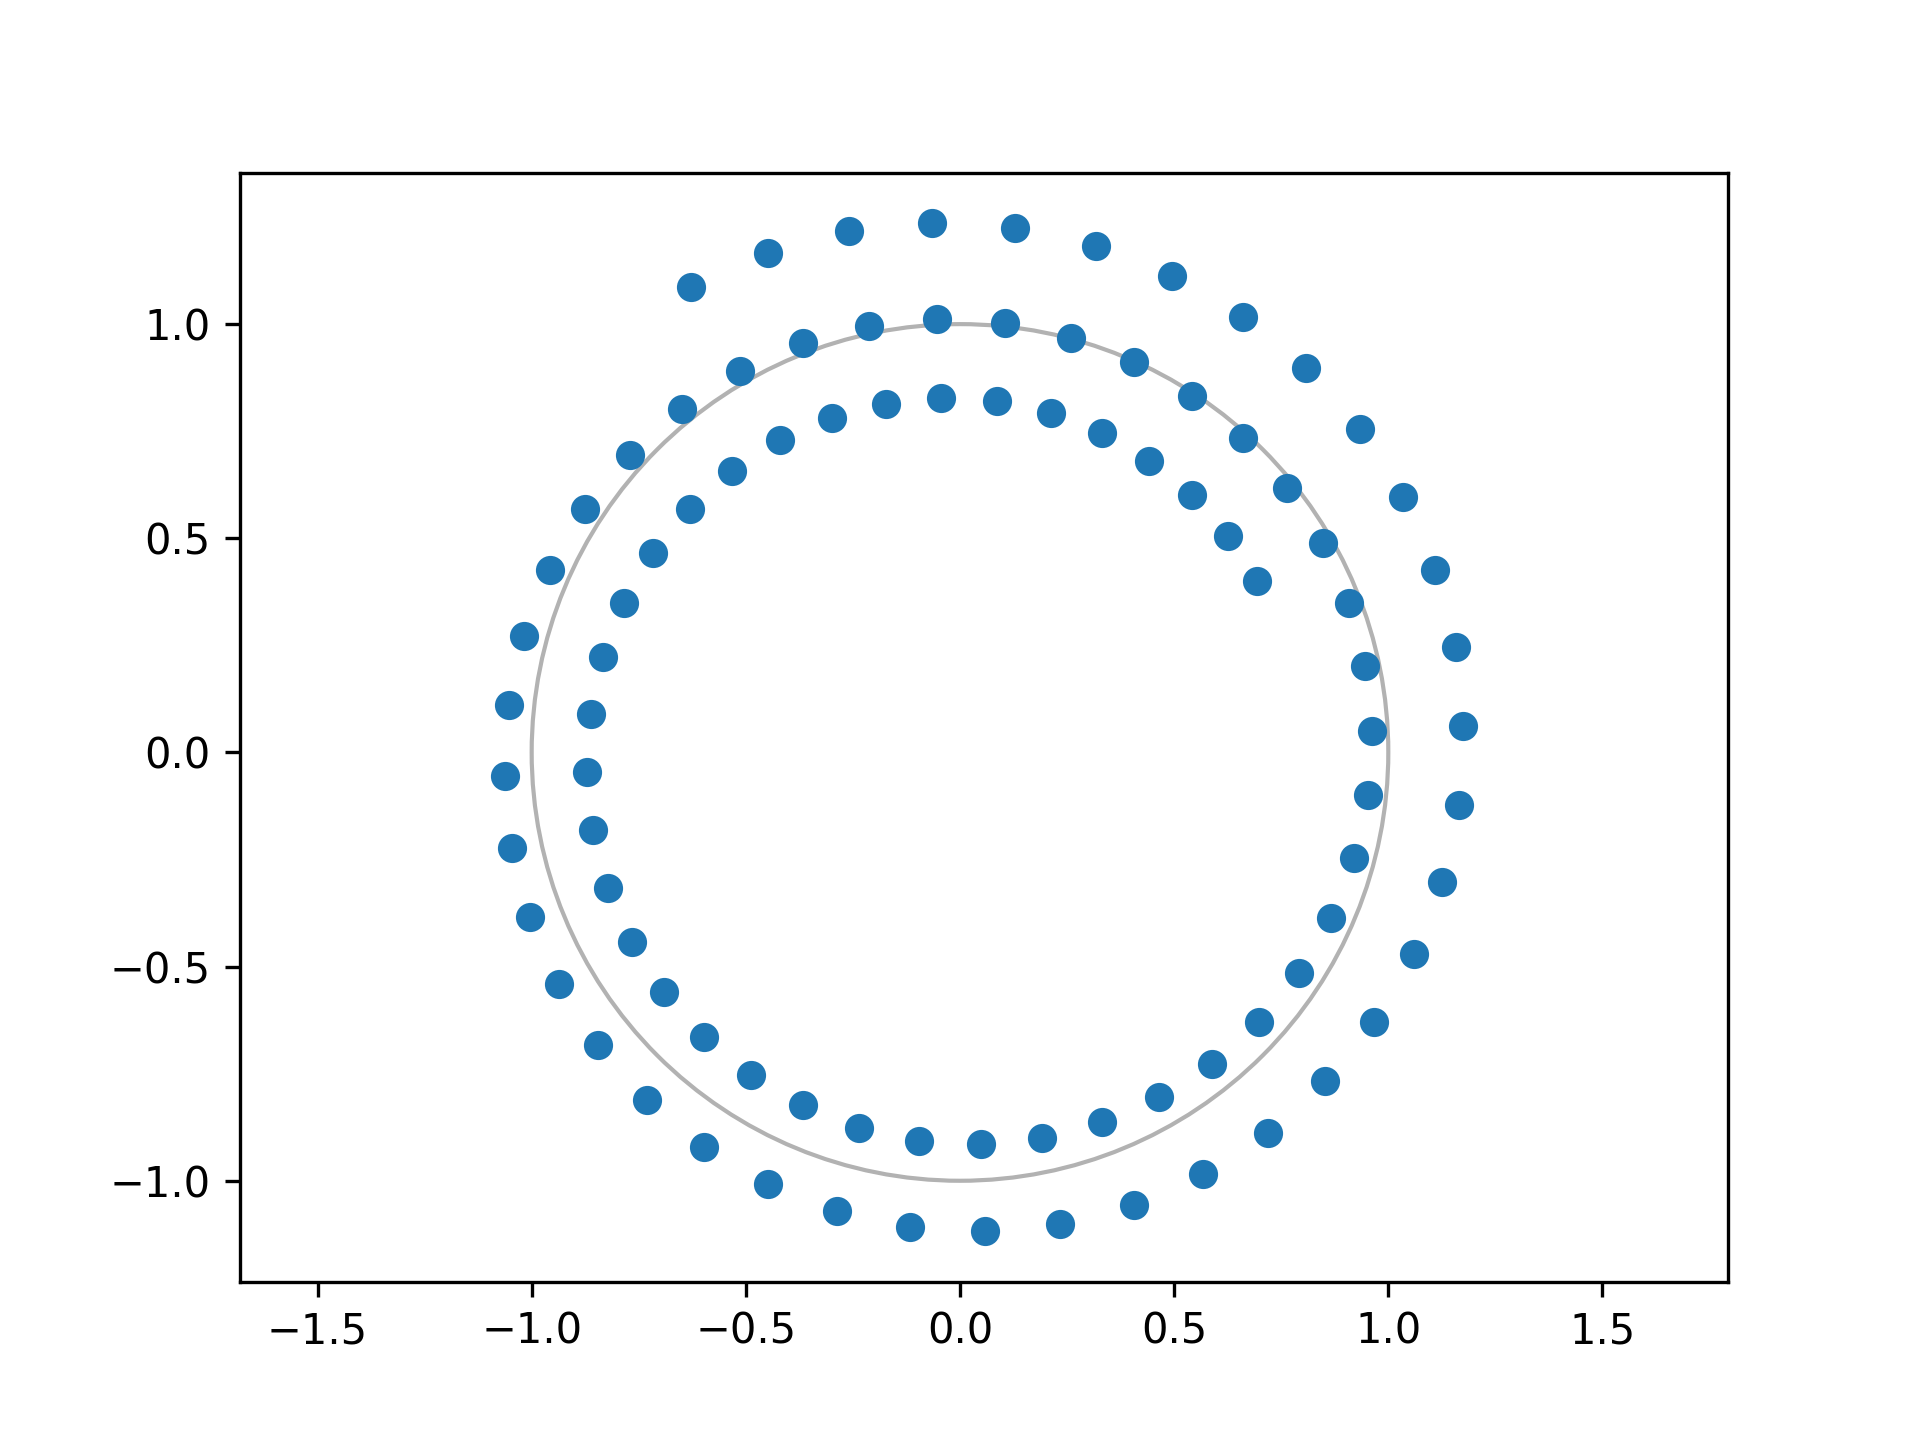
m, w, a = 91, 0.995*np.exp(-1j*np.pi*.05), 0.8*np.exp(1j*np.pi/6)
points = czt_points(m, w, a)
✓
plt.plot(points.real, points.imag, 'o')
plt.gca().add_patch(plt.Circle((0,0), radius=1, fill=False, alpha=.3))
plt.axis('equal')
✗
plt.show()
✓
See also
Aliases
-
scipy.signal.czt_points