bundles / scipy latest / scipy / signal / _fir_filter_design / kaiserord
function
scipy.signal._fir_filter_design:kaiserord
Signature
def kaiserord ( ripple , width ) Summary
Determine the filter window parameters for the Kaiser window method.
Extended Summary
The parameters returned by this function are generally used to create a finite impulse response filter using the window method, with either firwin or firwin2.
Parameters
ripple: floatUpper bound for the deviation (in dB) of the magnitude of the filter's frequency response from that of the desired filter (not including frequencies in any transition intervals). That is, if w is the frequency expressed as a fraction of the Nyquist frequency, A(w) is the actual frequency response of the filter and D(w) is the desired frequency response, the design requirement is that
abs(A(w) - D(w))) < 10**(-ripple/20)for 0 <= w <= 1 and w not in a transition interval.
width: floatWidth of transition region, normalized so that 1 corresponds to pi radians / sample. That is, the frequency is expressed as a fraction of the Nyquist frequency.
Returns
numtaps: intThe length of the Kaiser window.
beta: floatThe beta parameter for the Kaiser window.
Notes
There are several ways to obtain the Kaiser window:
signal.windows.kaiser(numtaps, beta, sym=True)signal.get_window(beta, numtaps)signal.get_window(('kaiser', beta), numtaps)
The empirical equations discovered by Kaiser are used.
Array API Standard Support
kaiserord is not in-scope for support of Python Array API Standard compatible backends other than NumPy.
See dev-arrayapi for more information.
Examples
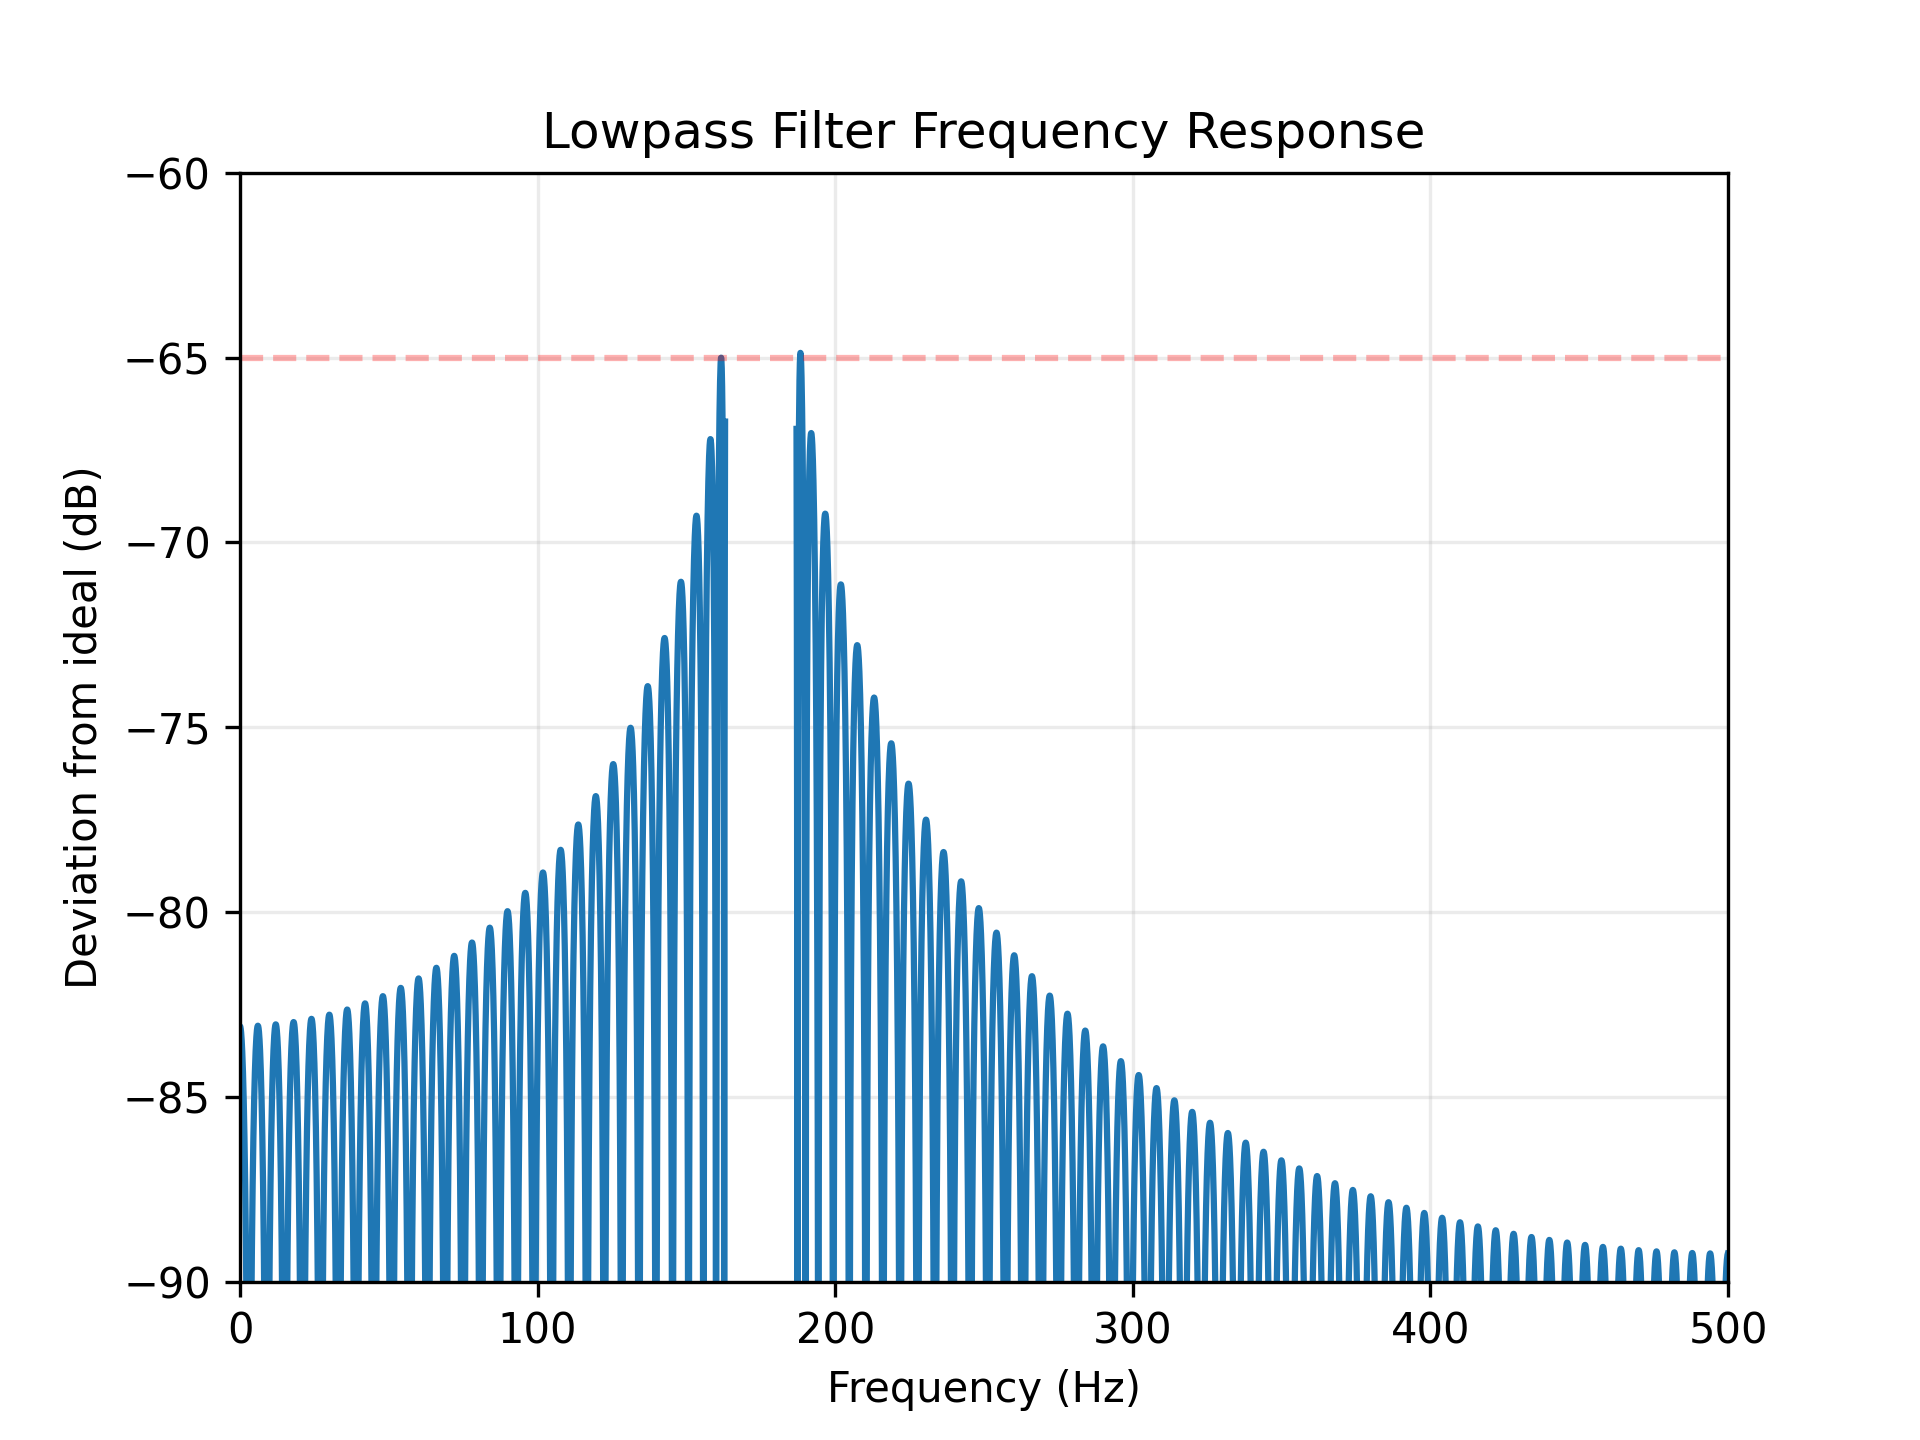
We will use the Kaiser window method to design a lowpass FIR filter for a signal that is sampled at 1000 Hz. We want at least 65 dB rejection in the stop band, and in the pass band the gain should vary no more than 0.5%. We want a cutoff frequency of 175 Hz, with a transition between the pass band and the stop band of 24 Hz. That is, in the band [0, 163], the gain varies no more than 0.5%, and in the band [187, 500], the signal is attenuated by at least 65 dB.import numpy as np from scipy.signal import kaiserord, firwin, freqz import matplotlib.pyplot as plt fs = 1000.0 cutoff = 175 width = 24✓
numtaps, beta = kaiserord(65, width/(0.5*fs))
numtaps
beta
✓
taps = firwin(numtaps, cutoff, window=('kaiser', beta),
              scale=False, fs=fs)
✓
w, h = freqz(taps, worN=8000)
w *= 0.5*fs/np.pi  # Convert w to Hz.
✓
ideal = w < cutoff  # The "ideal" frequency response.
deviation = np.abs(np.abs(h) - ideal)
deviation[(w > cutoff - 0.5*width) & (w < cutoff + 0.5*width)] = np.nan
✓
plt.plot(w, 20*np.log10(np.abs(deviation)))
plt.xlim(0, 0.5*fs)
plt.ylim(-90, -60)
✗
plt.grid(alpha=0.25)
✓plt.axhline(-65, color='r', ls='--', alpha=0.3) plt.xlabel('Frequency (Hz)') plt.ylabel('Deviation from ideal (dB)') plt.title('Lowpass Filter Frequency Response')✗
plt.show()
✓
See also
Aliases
-
scipy.signal.kaiserord