bundles / scipy latest / scipy / signal / _fir_filter_design / remez
function
scipy.signal._fir_filter_design:remez
Signature
def remez ( numtaps , bands , desired , * , weight = None , type = bandpass , maxiter = 25 , grid_density = 16 , fs = None ) Summary
Calculate the minimax optimal filter using the Remez exchange algorithm.
Extended Summary
Calculate the filter-coefficients for the finite impulse response (FIR) filter whose transfer function minimizes the maximum error between the desired gain and the realized gain in the specified frequency bands using the Remez exchange algorithm.
Parameters
numtaps: intThe desired number of taps in the filter. The number of taps is the number of terms in the filter, or the filter order plus one.
bands: array_likeA monotonic sequence containing the band edges. All elements must be non-negative and less than half the sampling frequency as given by
fs.desired: array_likeA sequence half the size of bands containing the desired gain in each of the specified bands.
weight: array_like, optionalA relative weighting to give to each band region. The length of
weighthas to be half the length ofbands.type: {'bandpass', 'differentiator', 'hilbert'}, optionalThe type of filter:
'bandpass'flat response in bands. This is the default.
'differentiator'frequency proportional response in bands.
'hilbert'
'hilbert'
maxiter: int, optionalMaximum number of iterations of the algorithm. Default is 25.
grid_density: int, optionalGrid density. The dense grid used in remez is of size
(numtaps + 1) * grid_density. Default is 16.fs: float, optionalThe sampling frequency of the signal. Default is 1.
Returns
out: ndarrayA rank-1 array containing the coefficients of the optimal (in a minimax sense) filter.
Notes
Array API Standard Support
remez has experimental support for Python Array API Standard compatible backends in addition to NumPy. Please consider testing these features by setting an environment variable SCIPY_ARRAY_API=1 and providing CuPy, PyTorch, JAX, or Dask arrays as array arguments. The following combinations of backend and device (or other capability) are supported.
====================  ====================  ====================
Library               CPU                   GPU
====================  ====================  ====================
NumPy                 ✅                     n/a
CuPy                  n/a                   ⛔
PyTorch               ✅                     ⛔
JAX                   ⚠️ no JIT             ⛔
Dask                  ⚠️ computes graph     n/a
====================  ====================  ====================
See
dev-arrayapifor more information.
Examples
In these examples, `remez` is used to design low-pass, high-pass, band-pass and band-stop filters. The parameters that define each filter are the filter order, the band boundaries, the transition widths of the boundaries, the desired gains in each band, and the sampling frequency. We'll use a sample frequency of 22050 Hz in all the examples. In each example, the desired gain in each band is either 0 (for a stop band) or 1 (for a pass band). `freqz` is used to compute the frequency response of each filter, and the utility function ``plot_response`` defined below is used to plot the response.import numpy as np from scipy import signal import matplotlib.pyplot as plt✓
fs = 22050 # Sample rate, Hz
✓def plot_response(w, h, title): "Utility function to plot response functions" fig = plt.figure() ax = fig.add_subplot(111) ax.plot(w, 20*np.log10(np.abs(h))) ax.set_ylim(-40, 5) ax.grid(True) ax.set_xlabel('Frequency (Hz)') ax.set_ylabel('Gain (dB)') ax.set_title(title)✓
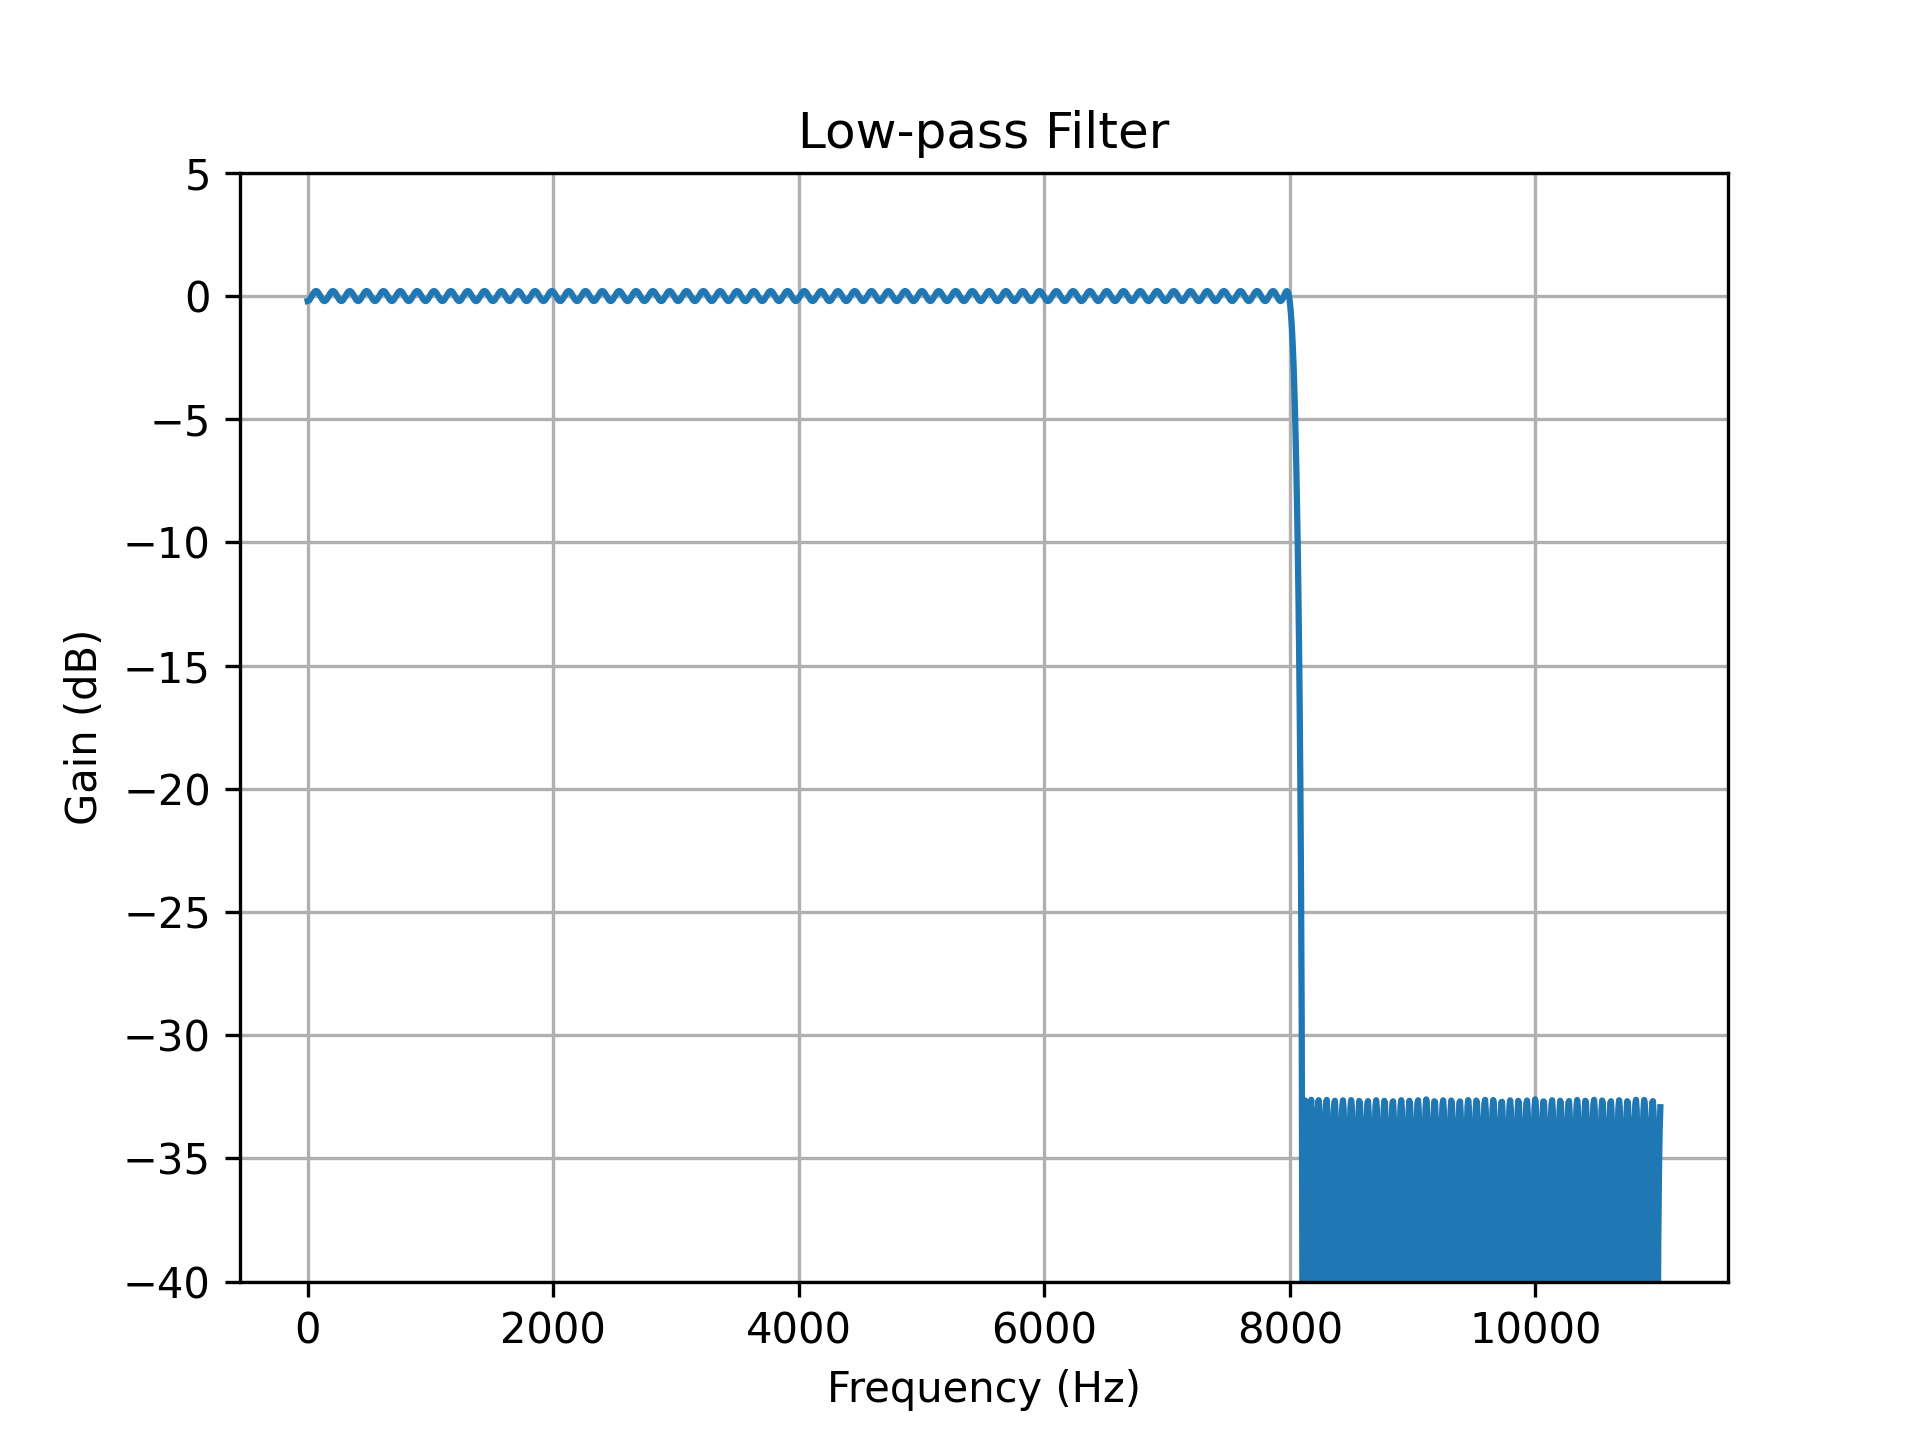
cutoff = 8000.0    # Desired cutoff frequency, Hz
trans_width = 100  # Width of transition from pass to stop, Hz
numtaps = 325      # Size of the FIR filter.
taps = signal.remez(numtaps, [0, cutoff, cutoff + trans_width, 0.5*fs],
                    [1, 0], fs=fs)
w, h = signal.freqz(taps, [1], worN=2000, fs=fs)
plot_response(w, h, "Low-pass Filter")
plt.show()
✓
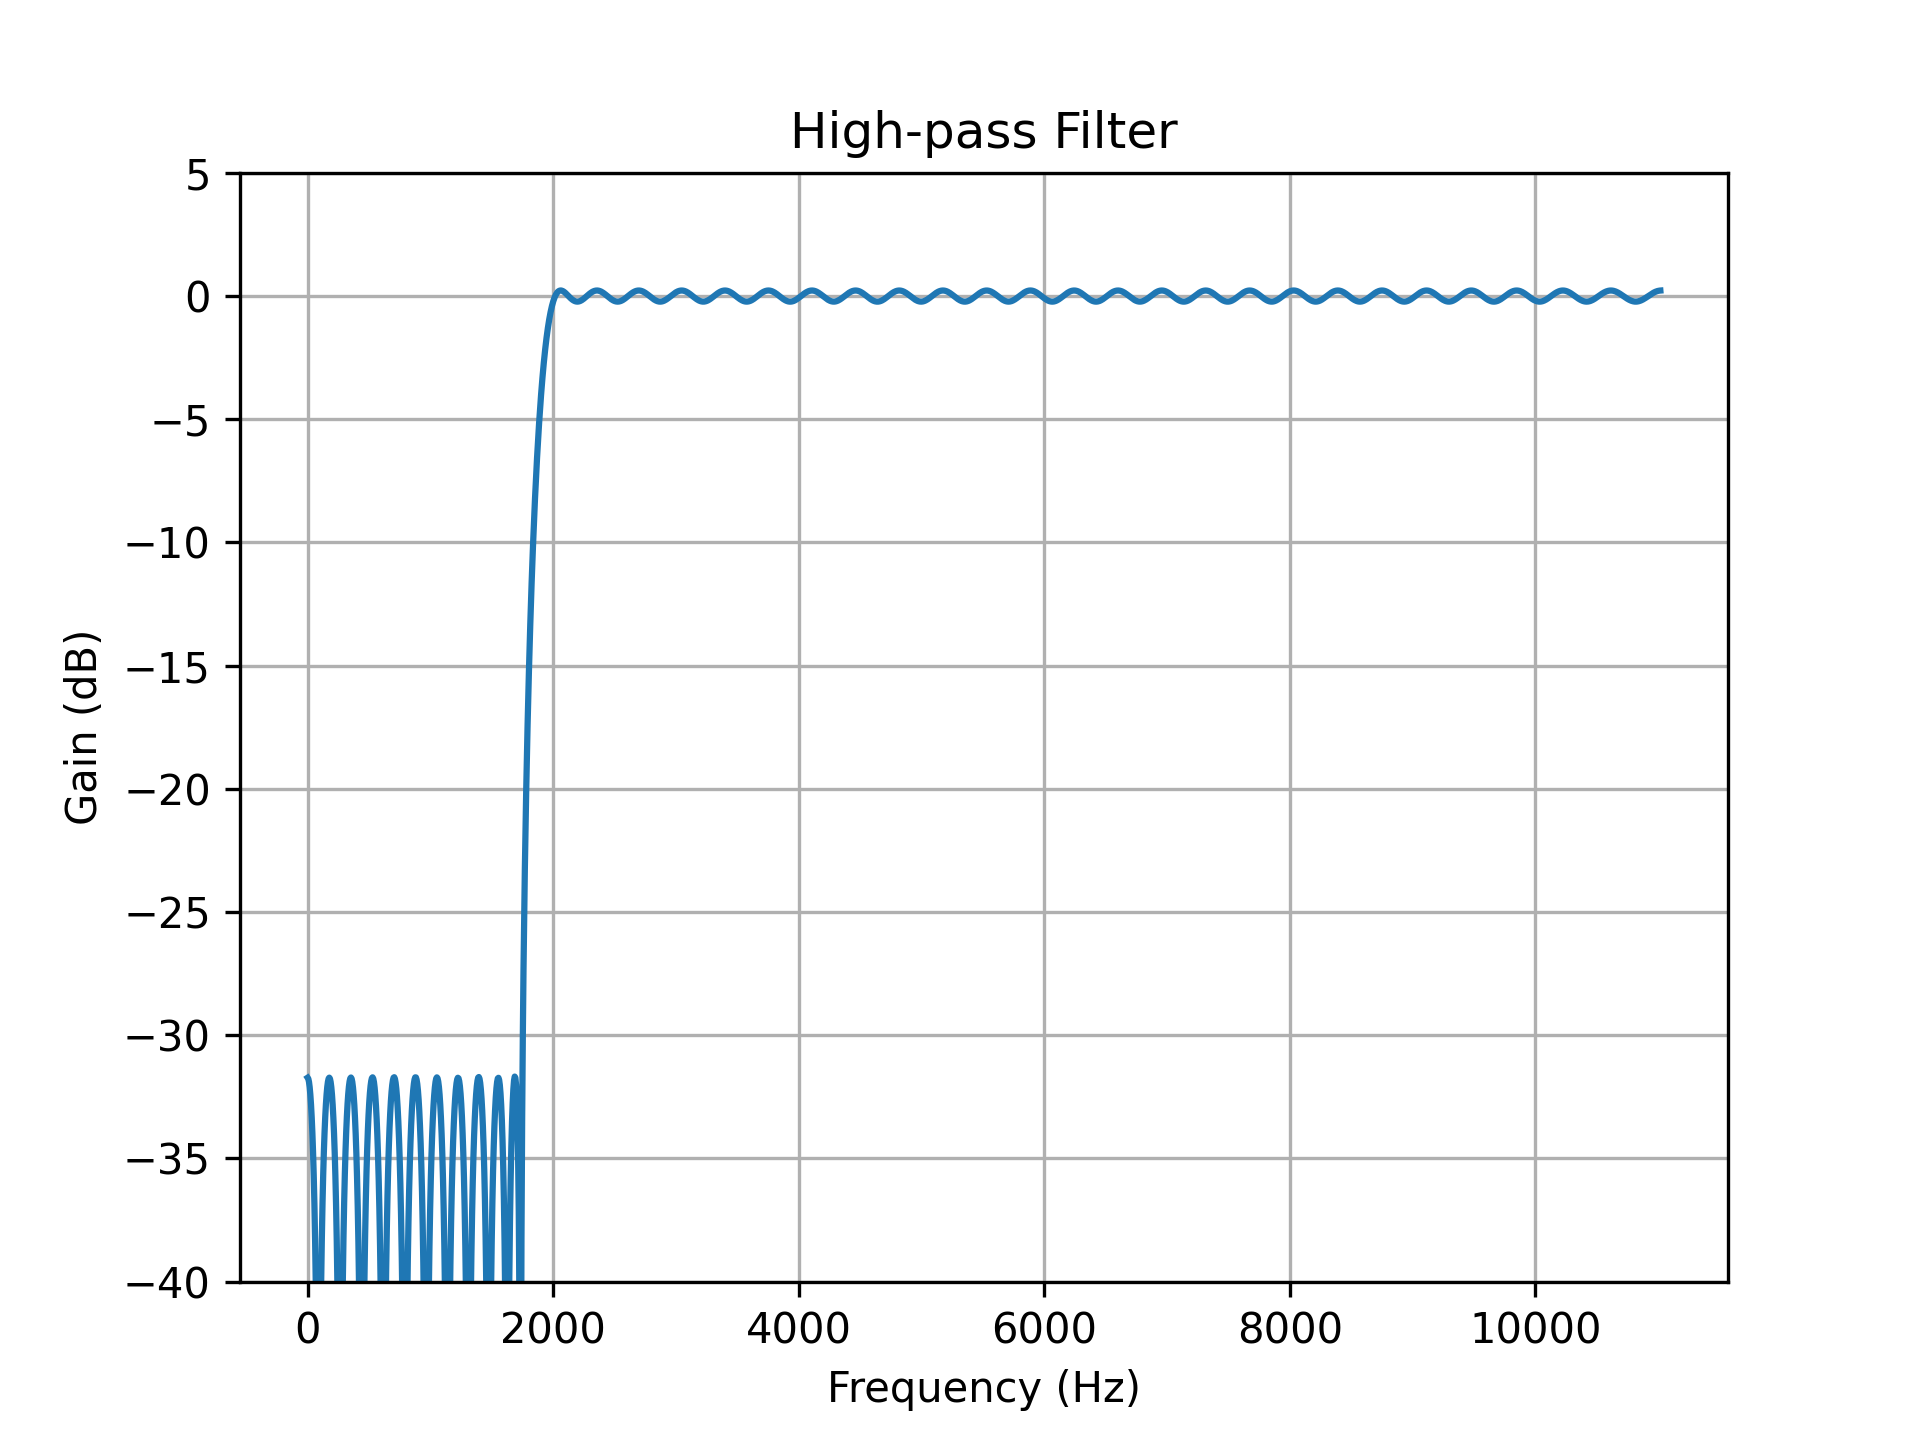
cutoff = 2000.0    # Desired cutoff frequency, Hz
trans_width = 250  # Width of transition from pass to stop, Hz
numtaps = 125      # Size of the FIR filter.
taps = signal.remez(numtaps, [0, cutoff - trans_width, cutoff, 0.5*fs],
                    [0, 1], fs=fs)
w, h = signal.freqz(taps, [1], worN=2000, fs=fs)
plot_response(w, h, "High-pass Filter")
plt.show()
✓
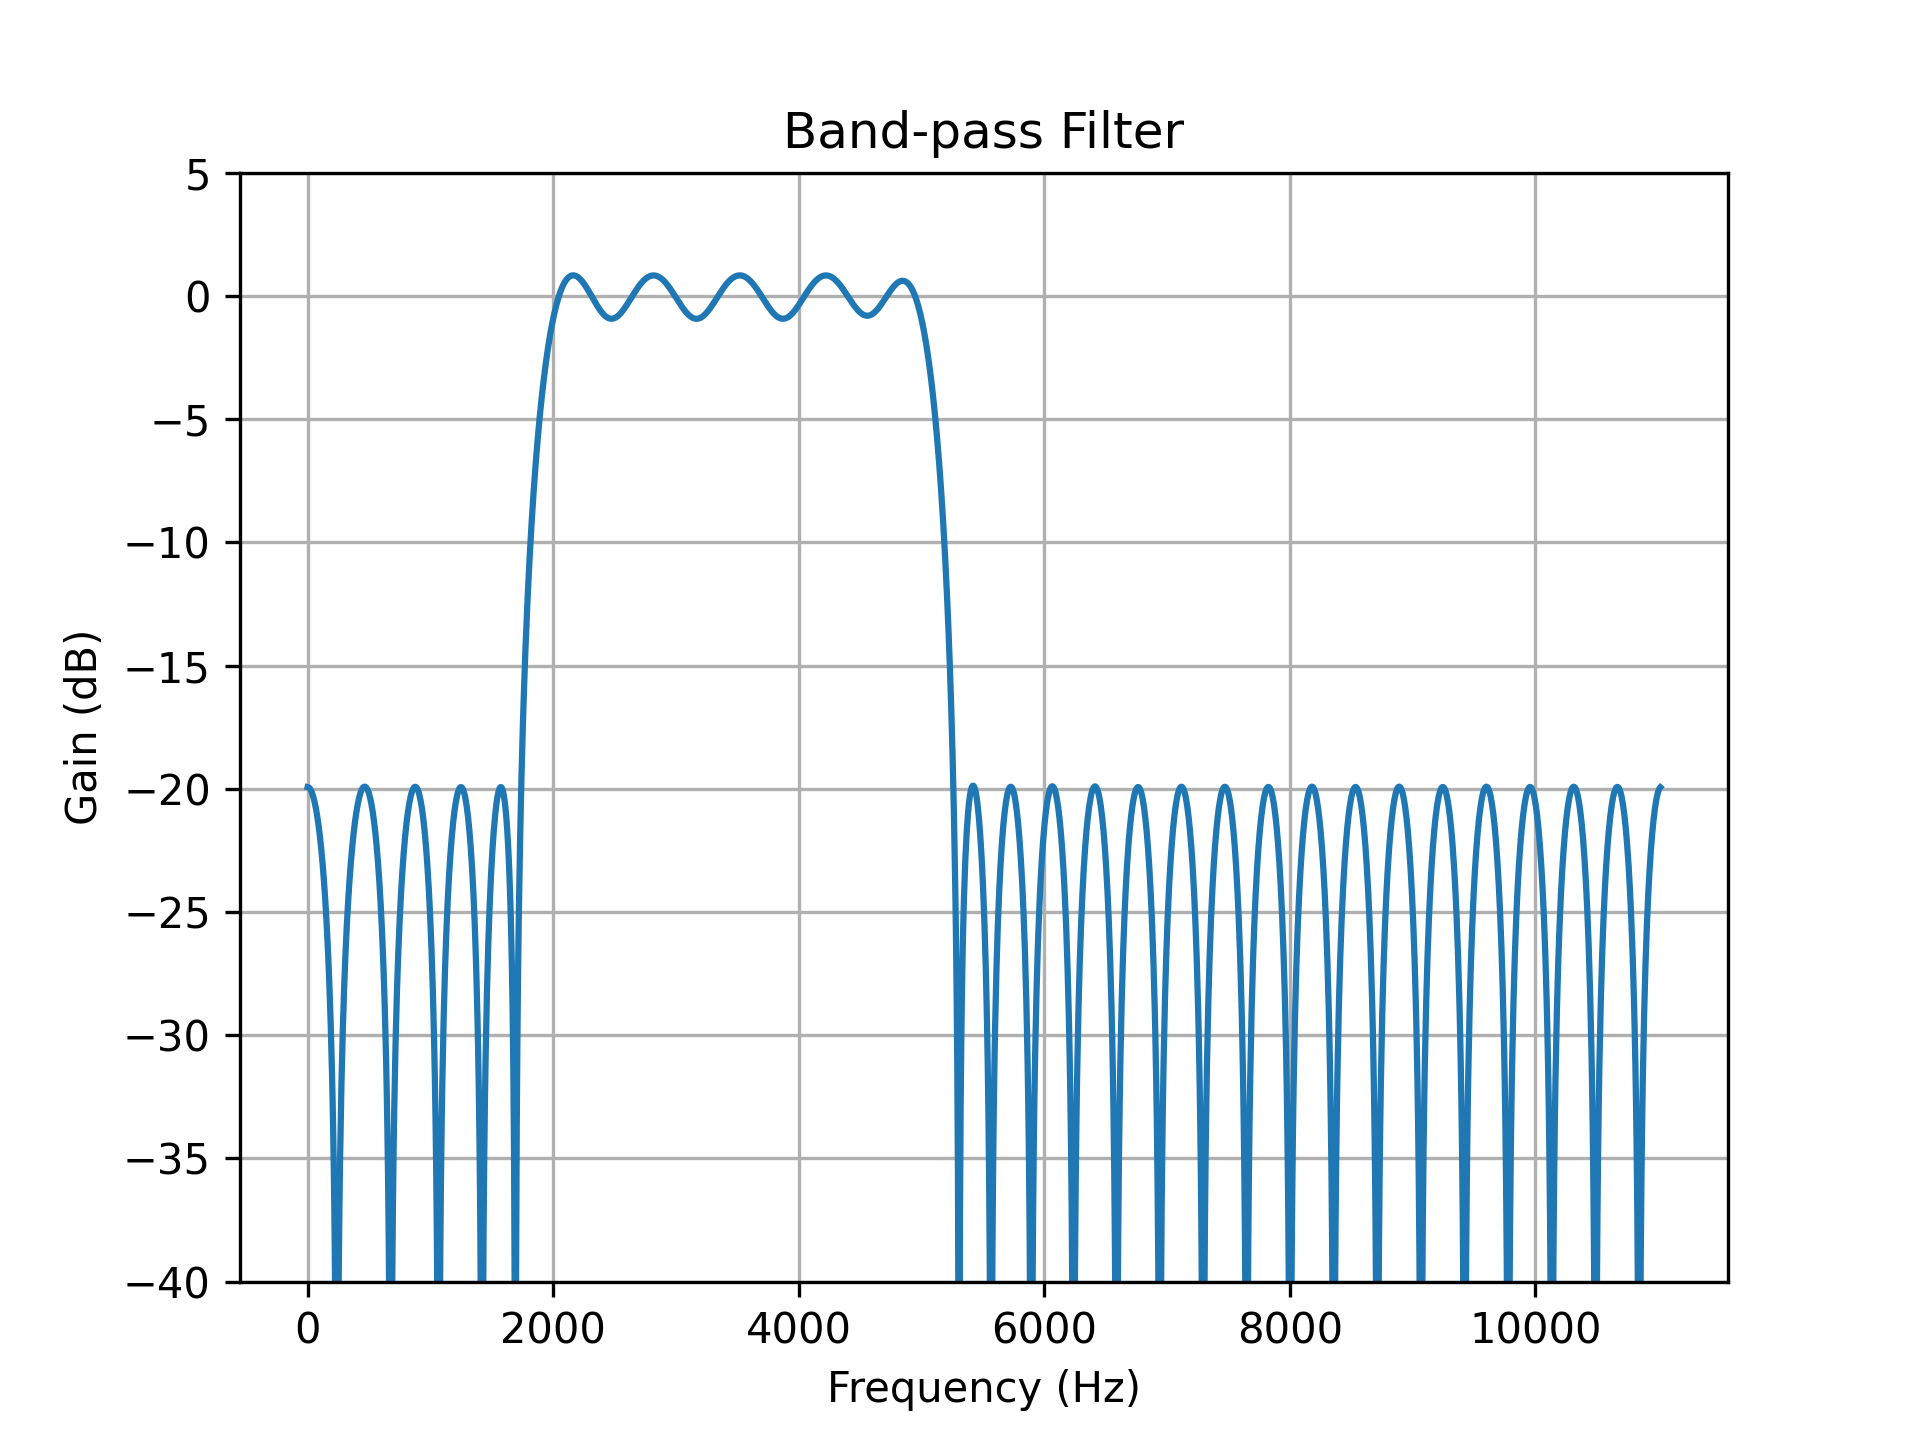
band = [2000, 5000]  # Desired pass band, Hz
trans_width = 260    # Width of transition from pass to stop, Hz
numtaps = 63         # Size of the FIR filter.
edges = [0, band[0] - trans_width, band[0], band[1],
         band[1] + trans_width, 0.5*fs]
taps = signal.remez(numtaps, edges, [0, 1, 0], fs=fs)
w, h = signal.freqz(taps, [1], worN=2000, fs=fs)
plot_response(w, h, "Band-pass Filter")
plt.show()
✓
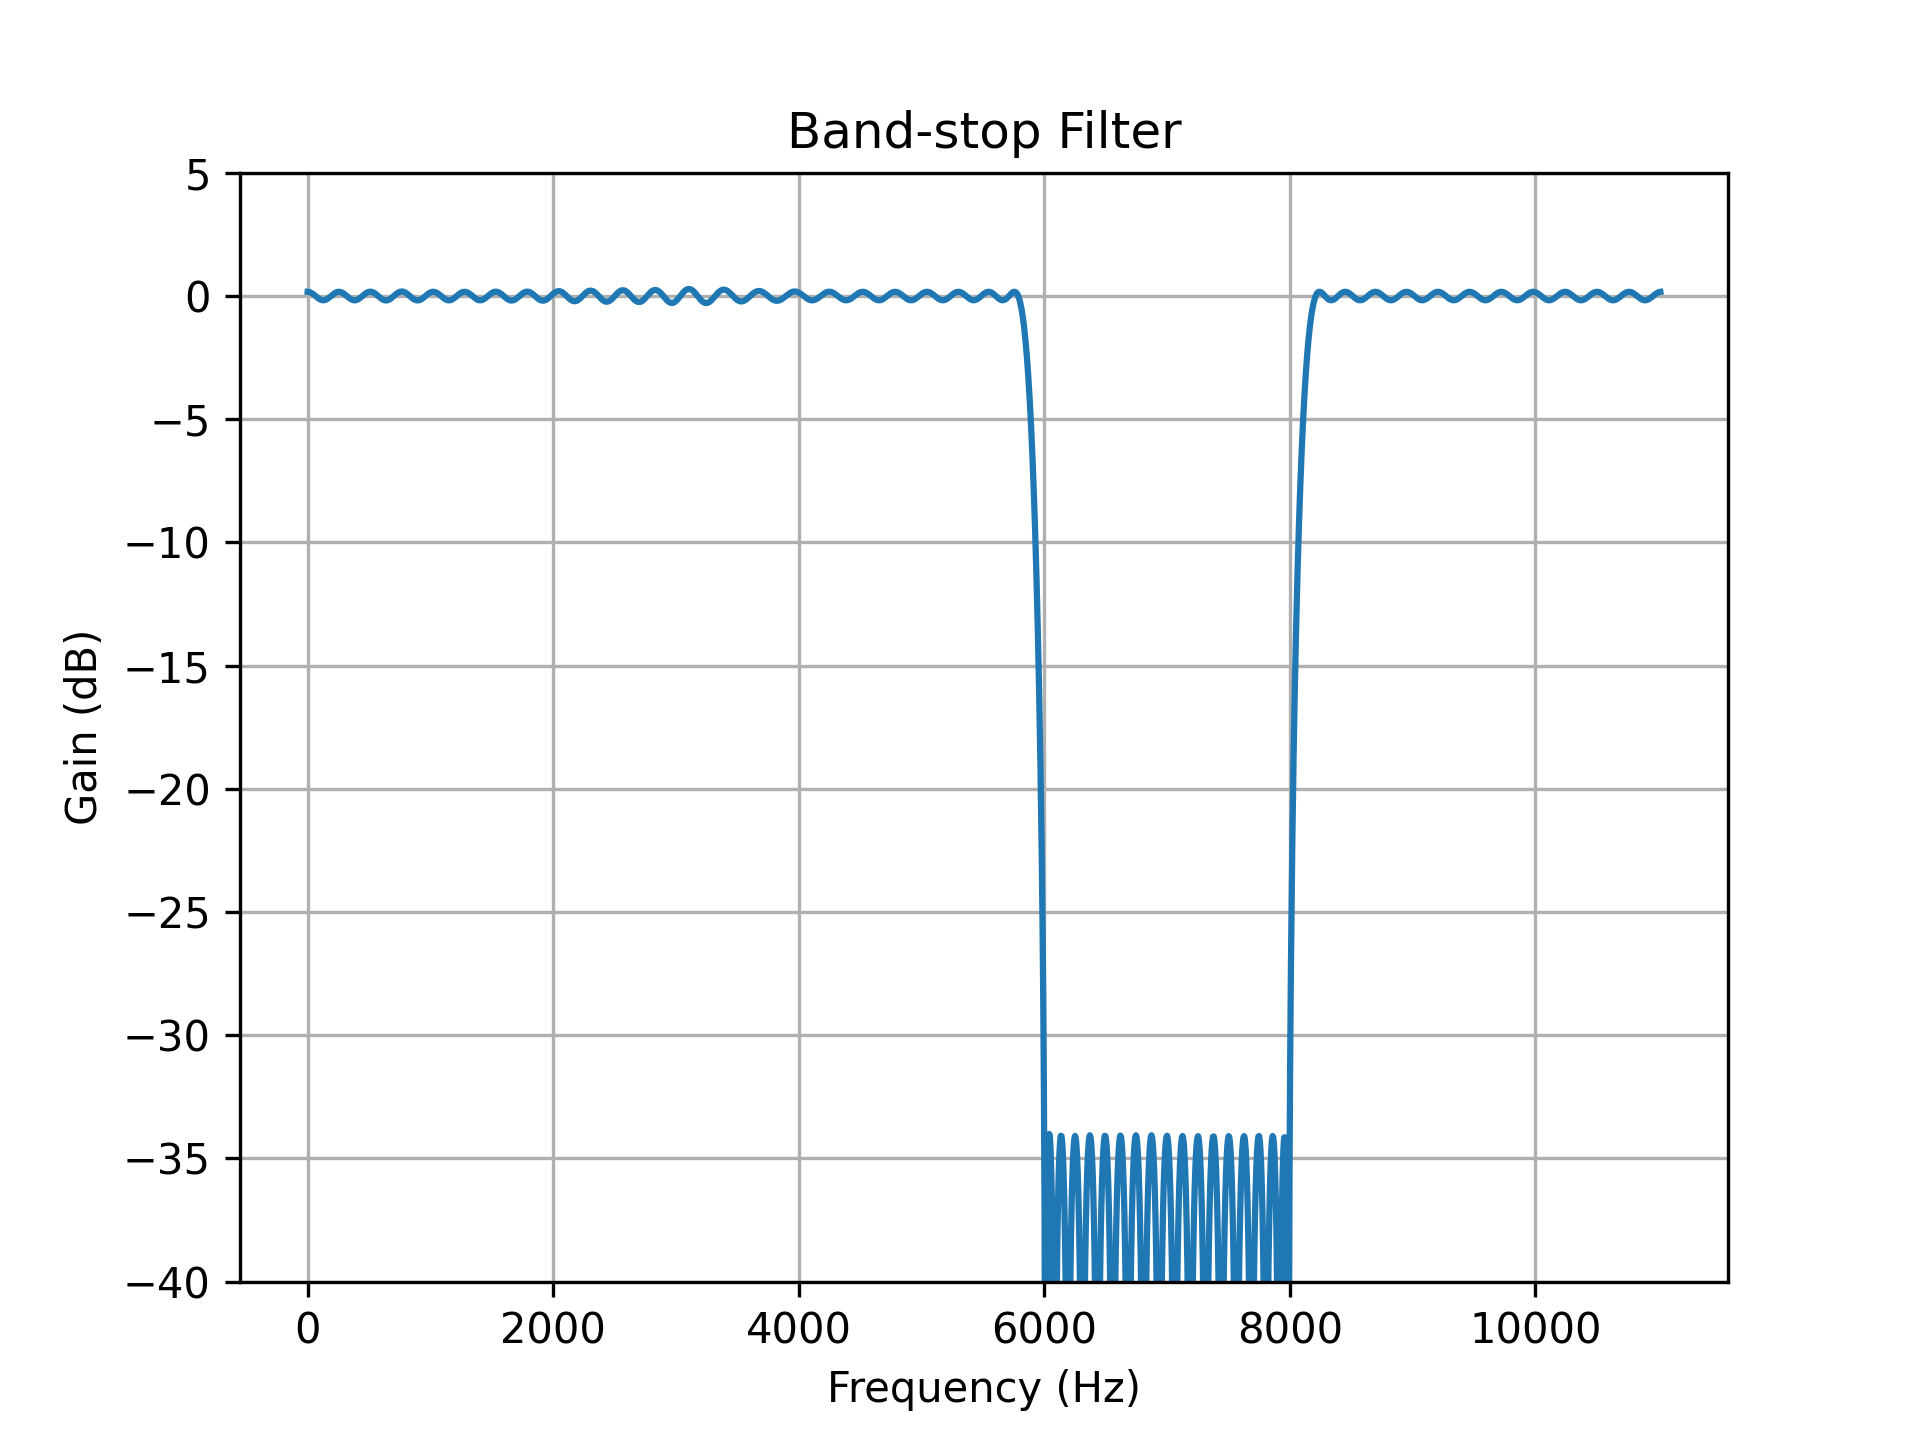
band = [6000, 8000]  # Desired stop band, Hz
trans_width = 200    # Width of transition from pass to stop, Hz
numtaps = 175        # Size of the FIR filter.
edges = [0, band[0] - trans_width, band[0], band[1],
         band[1] + trans_width, 0.5*fs]
taps = signal.remez(numtaps, edges, [1, 0, 1], fs=fs)
w, h = signal.freqz(taps, [1], worN=2000, fs=fs)
plot_response(w, h, "Band-stop Filter")
plt.show()
✓
See also
Aliases
-
scipy.signal.remez