bundles / scipy latest / scipy / stats / _multivariate / invwishart_gen
class
scipy.stats._multivariate:invwishart_gen
Signature
class invwishart_gen ( seed = None ) Members
-
__call__ -
__init__ -
_entropy -
_inv_standard_rvs -
_logpdf -
_mean -
_mode -
_rvs -
_var -
entropy -
logpdf -
mean -
mode -
pdf -
rvs -
var
Summary
An inverse Wishart random variable.
Extended Summary
The df keyword specifies the degrees of freedom. The scale keyword specifies the scale matrix, which must be symmetric and positive definite. In this context, the scale matrix is often interpreted in terms of a multivariate normal covariance matrix.
Parameters
%(_doc_default_callparams)s%(_doc_random_state)s
Methods
pdf(x, df, scale)Probability density function.
logpdf(x, df, scale)Log of the probability density function.
rvs(df, scale, size=1, random_state=None)Draw random samples from an inverse Wishart distribution.
entropy(df, scale)Differential entropy of the distribution.
Raises
: scipy.linalg.LinAlgErrorIf the scale matrix scale is not positive definite.
Notes
%(_doc_callparams_note)s
The scale matrix scale must be a symmetric positive definite matrix. Singular matrices, including the symmetric positive semi-definite case, are not supported. Symmetry is not checked; only the lower triangular portion is used.
The inverse Wishart distribution is often denoted
where is the degrees of freedom and is the scale matrix.
The probability density function for invwishart has support over positive definite matrices ; if , then its PDF is given by:
If (inverse Wishart) then (Wishart).
If the scale matrix is 1-dimensional and equal to one, then the inverse Wishart distribution collapses to the inverse Gamma distribution with parameters shape = and scale = .
Instead of inverting a randomly generated Wishart matrix as described in [2], here the algorithm in [4] is used to directly generate a random inverse-Wishart matrix without inversion.
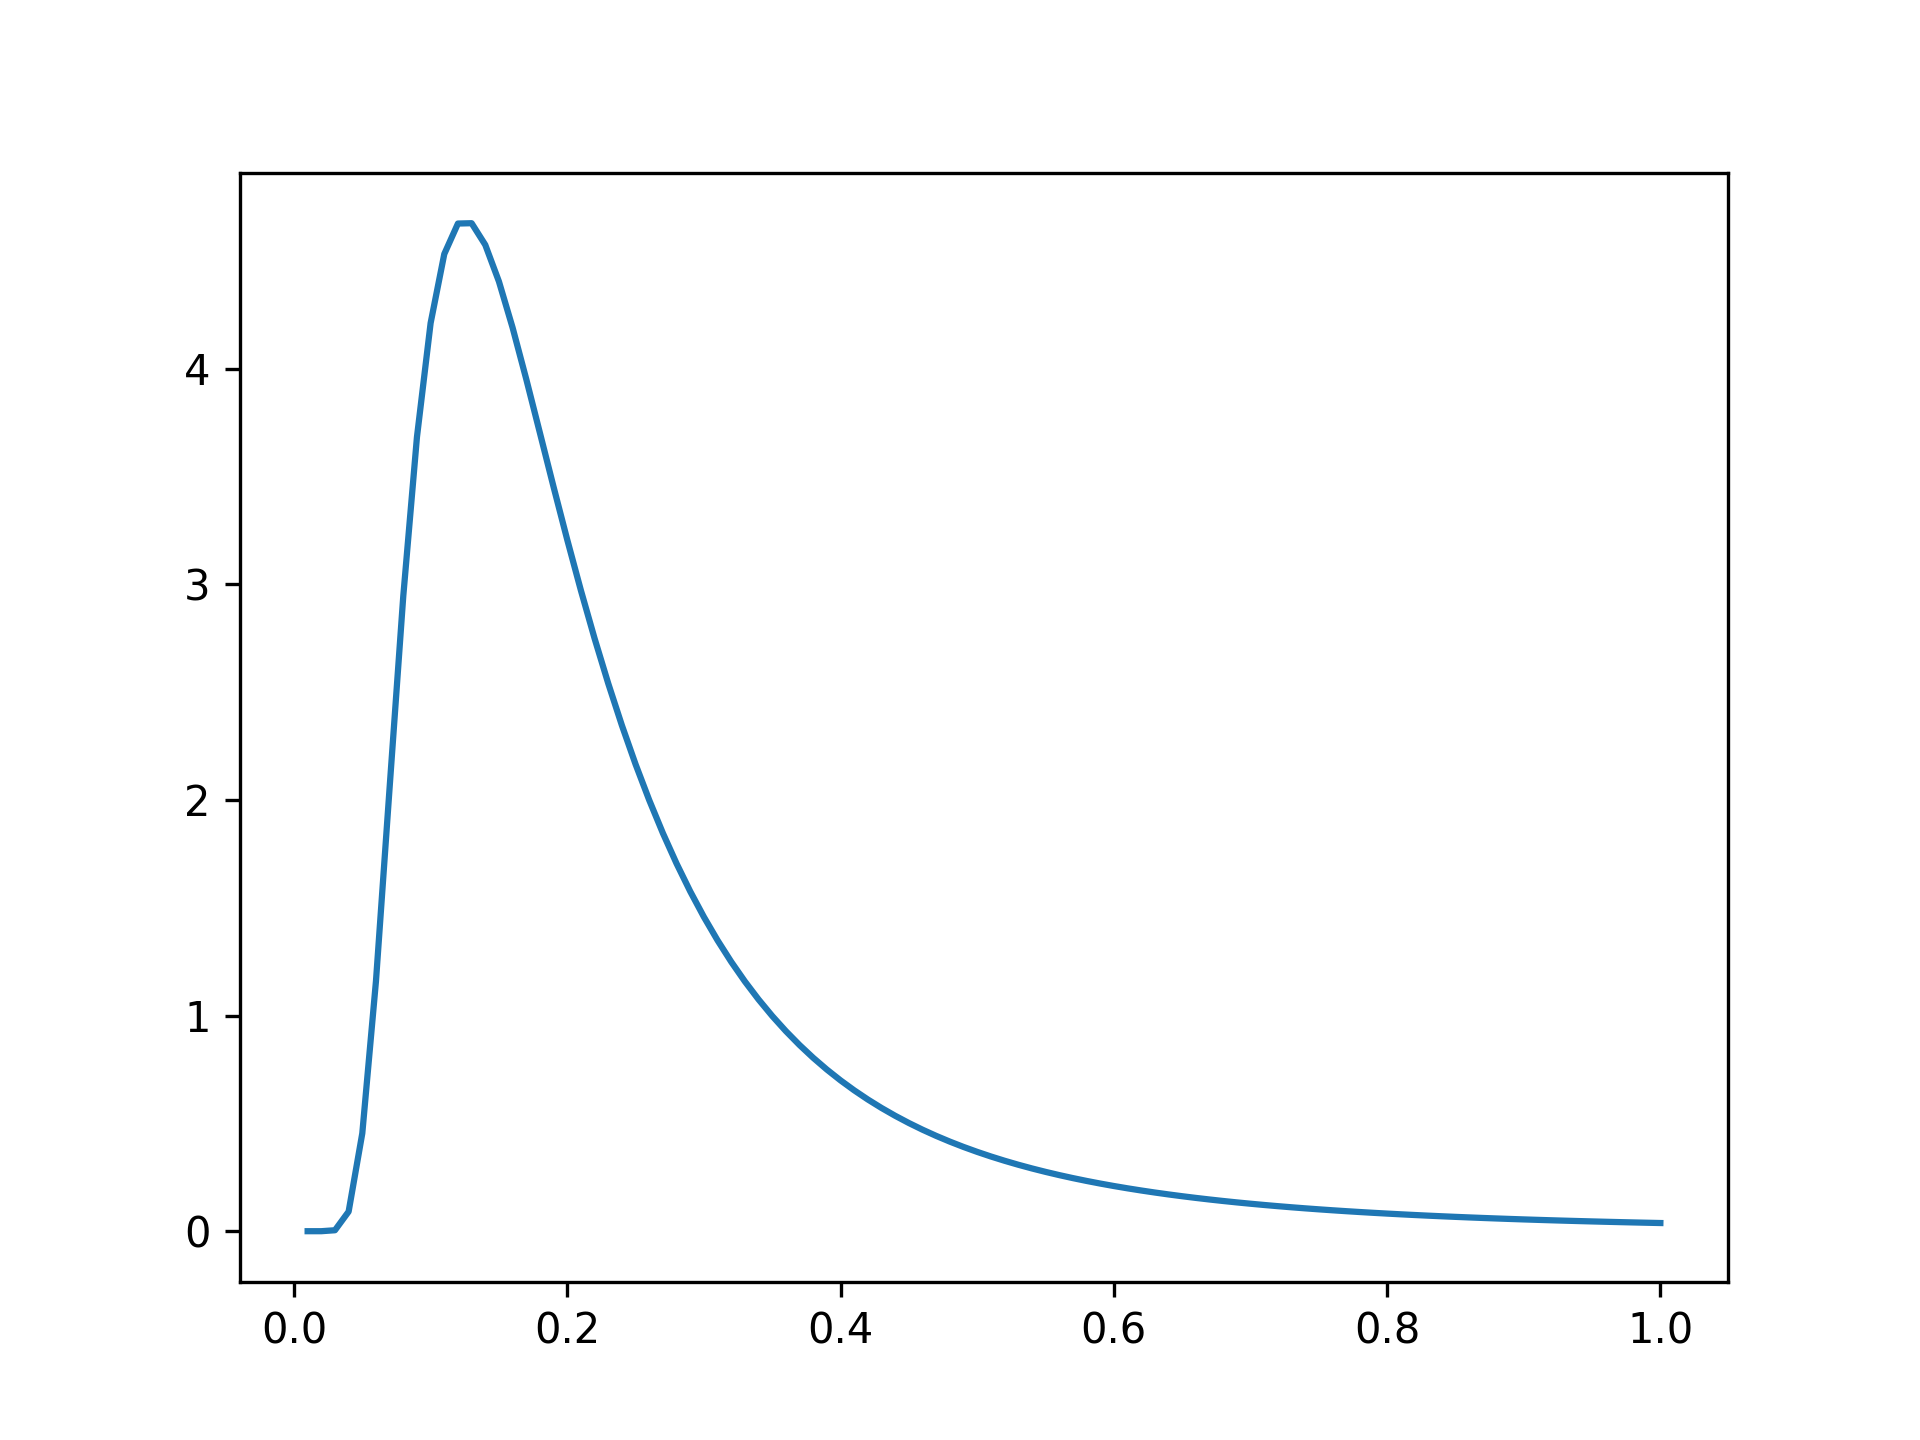
Examples
import numpy as np
import matplotlib.pyplot as plt
from scipy.stats import invwishart, invgamma
x = np.linspace(0.01, 1, 100)
iw = invwishart.pdf(x, df=6, scale=1)
✓
iw[:3]
✗ig = invgamma.pdf(x, 6/2., scale=1./2)
✓ig[:3] plt.plot(x, iw)✗
plt.show()
✓
rv = invwishart(df=1, scale=1)
✓See also
- wishart
Aliases
-
scipy.stats._multivariate.invwishart_gen