bundles / scipy latest / scipy / stats / _multivariate / normal_inverse_gamma_gen
class
scipy.stats._multivariate:normal_inverse_gamma_gen
source: build-install/usr/lib/python3.14/site-packages/scipy/stats/_multivariate.py:7725
Signature
class normal_inverse_gamma_gen(seed = None)Members
Summary
Normal-inverse-gamma distribution.
Extended Summary
The normal-inverse-gamma distribution is the conjugate prior of a normal distribution with unknown mean and variance.
Parameters
mu, lmbda, a, b: array_likeShape parameters of the distribution. See notes.
seed: {None, int, np.random.RandomState, np.random.Generator}, optionalUsed for drawing random variates. If
seedis None, the~np.random.RandomStatesingleton is used. Ifseedis an int, a newRandomStateinstance is used, seeded with seed. Ifseedis already aRandomStateorGeneratorinstance, then that object is used. Default is None.
Methods
pdf(x, s2, mu=0, lmbda=1, a=1, b=1)Probability density function.
logpdf(x, s2, mu=0, lmbda=1, a=1, b=1)Log of the probability density function.
mean(mu=0, lmbda=1, a=1, b=1)Distribution mean.
var(mu=0, lmbda=1, a=1, b=1)Distribution variance.
rvs(mu=0, lmbda=1, a=1, b=1, size=None, random_state=None)Draw random samples.
Notes
The probability density function of normal_inverse_gamma is:
where all parameters are real and finite, and , , , and .
Methods normal_inverse_gamma.pdf and normal_inverse_gamma.logpdf accept x and s2 for arguments and . All methods accept mu, lmbda, a, and b for shape parameters , , , and , respectively.
Examples
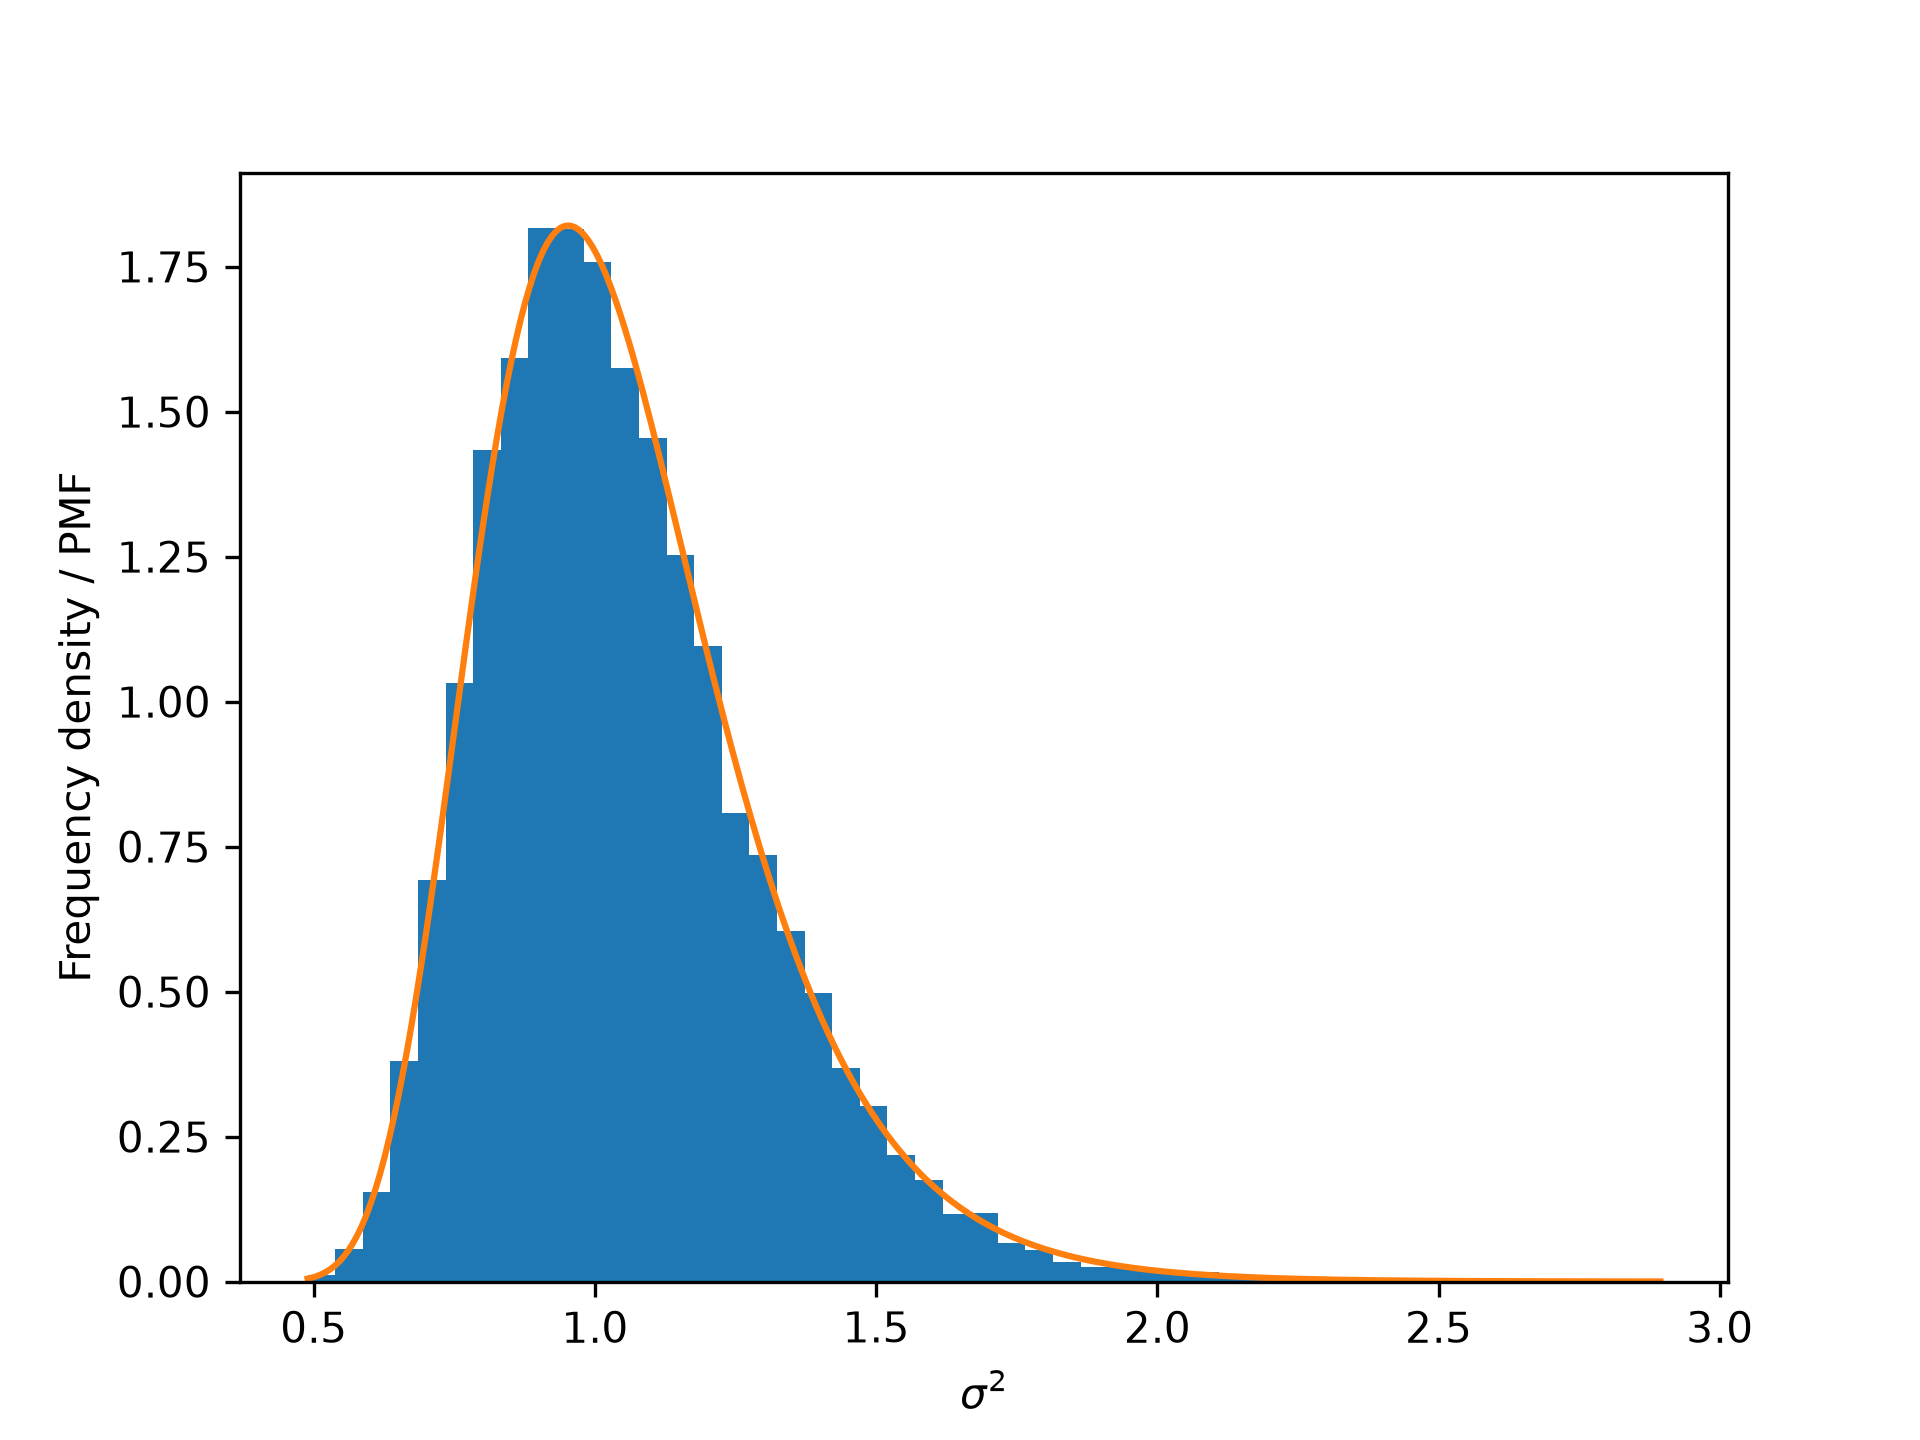
Suppose we wish to investigate the relationship between the normal-inverse-gamma distribution and the inverse gamma distribution.import numpy as np from scipy import stats import matplotlib.pyplot as plt rng = np.random.default_rng(527484872345) mu, lmbda, a, b = 0, 1, 20, 20 norm_inv_gamma = stats.normal_inverse_gamma(mu, lmbda, a, b) inv_gamma = stats.invgamma(a, scale=b)✓
_, s2 = norm_inv_gamma.rvs(size=10000, random_state=rng)
bins = np.linspace(s2.min(), s2.max(), 50)
✓
plt.hist(s2, bins=bins, density=True, label='Frequency density')
✗(array([0.01222, 0.05704, 0.15483, 0.38097, 0.69267, 1.03289, 1.43422,
1.59313, 1.81723, 1.81519, 1.75815, 1.5748 , 1.4546 , 1.25291,
1.09604, 0.80879, 0.73545, 0.60506, 0.49709, 0.36874, 0.30355,
0.21799, 0.1752 , 0.11612, 0.11816, 0.06723, 0.05501, 0.03463,
0.02445, 0.02648, 0.01834, 0.0163 , 0.0163 , 0.00611, 0.00407,
0.00407, 0.00815, 0.00407, 0.00204, 0.00407, 0. , 0.00204,
0.00204, 0.00204, 0. , 0. , 0. , 0. , 0.00204]), array([0.48915, 0.53824, 0.58732, 0.63641, 0.68549, 0.73458, 0.78367,
0.83275, 0.88184, 0.93092, 0.98001, 1.02909, 1.07818, 1.12727,
1.17635, 1.22544, 1.27452, 1.32361, 1.3727 , 1.42178, 1.47087,
1.51995, 1.56904, 1.61812, 1.66721, 1.7163 , 1.76538, 1.81447,
1.86355, 1.91264, 1.96172, 2.01081, 2.0599 , 2.10898, 2.15807,
2.20715, 2.25624, 2.30532, 2.35441, 2.4035 , 2.45258, 2.50167,
2.55075, 2.59984, 2.64892, 2.69801, 2.7471 , 2.79618, 2.84527,
2.89435]), <BarContainer object of 49 artists>)
s2 = np.linspace(s2.min(), s2.max(), 300)
✓plt.plot(s2, inv_gamma.pdf(s2), label='PDF') plt.xlabel(r'$\sigma^2$') plt.ylabel('Frequency density / PMF')✗
Text(0, 0.5, 'Frequency density / PMF')
plt.show()
✓
from scipy.integrate import quad_vec
from scipy import integrate
s2 = np.linspace(0.5, 3, 6)
res = quad_vec(lambda x: norm_inv_gamma.pdf(x, s2), -np.inf, np.inf)[0]
np.allclose(res, inv_gamma.pdf(s2))
✓
TrueThe sample mean is comparable to the mean of the distribution.
x, s2 = norm_inv_gamma.rvs(size=10000, random_state=rng)
✓x.mean(), s2.mean()
✗(np.float64(-0.005254750127304422), np.float64(1.0504381114365078))
norm_inv_gamma.mean()
✓(np.float64(0.0), np.float64(1.0526315789473684))Similarly, for the variance:
x.var(ddof=1), s2.var(ddof=1)
norm_inv_gamma.var()
✓
(np.float64(1.0526315789473684), np.float64(0.061557402277623886))
See also
- invgamma
- norm
Aliases
scipy.stats._multivariate.normal_inverse_gamma_gen