bundles / scipy latest / scipy / stats / _stats_py / linregress
function
scipy.stats._stats_py:linregress
source: /scipy/stats/_stats_py.py :10394
Signature
def linregress ( x , y , alternative = two-sided , * , axis = 0 , nan_policy = propagate , keepdims = False ) Summary
Calculate a linear least-squares regression for two sets of measurements.
Parameters
x, y: array_likeTwo sets of measurements. Both arrays should have the same length N.
alternative: {'two-sided', 'less', 'greater'}, optionalDefines the alternative hypothesis. Default is 'two-sided'. The following options are available:
'two-sided': the slope of the regression line is nonzero
'less': the slope of the regression line is less than zero
'greater': the slope of the regression line is greater than zero
axis: int or None, default: 0If an int, the axis of the input along which to compute the statistic. The statistic of each axis-slice (e.g. row) of the input will appear in a corresponding element of the output. If
None, the input will be raveled before computing the statistic.nan_policy: {'propagate', 'omit', 'raise'}Defines how to handle input NaNs.
propagate: if a NaN is present in the axis slice (e.g. row) along which the statistic is computed, the corresponding entry of the output will be NaN.omit: NaNs will be omitted when performing the calculation. If insufficient data remains in the axis slice along which the statistic is computed, the corresponding entry of the output will be NaN.raise: if a NaN is present, aValueErrorwill be raised.
keepdims: bool, default: FalseIf this is set to True, the axes which are reduced are left in the result as dimensions with size one. With this option, the result will broadcast correctly against the input array.
Returns
result: ``LinregressResult`` instanceThe return value is an object with the following attributes:
slope
slope
intercept
intercept
rvalue
rvalue
pvalue
pvalue
stderr
stderr
intercept_stderr
intercept_stderr
Notes
For compatibility with older versions of SciPy, the return value acts like a namedtuple of length 5, with fields slope, intercept, rvalue, pvalue and stderr, so one can continue to write
slope, intercept, r, p, se = linregress(x, y)With that style, however, the standard error of the intercept is not available. To have access to all the computed values, including the standard error of the intercept, use the return value as an object with attributes, e.g.
result = linregress(x, y)
print(result.intercept, result.intercept_stderr)
Beginning in SciPy 1.9, np.matrix inputs (not recommended for new code) are converted to np.ndarray before the calculation is performed. In this case, the output will be a scalar or np.ndarray of appropriate shape rather than a 2D np.matrix. Similarly, while masked elements of masked arrays are ignored, the output will be a scalar or np.ndarray rather than a masked array with mask=False.
Array API Standard Support
linregress has experimental support for Python Array API Standard compatible backends in addition to NumPy. Please consider testing these features by setting an environment variable SCIPY_ARRAY_API=1 and providing CuPy, PyTorch, JAX, or Dask arrays as array arguments. The following combinations of backend and device (or other capability) are supported.
====================  ====================  ====================
Library               CPU                   GPU
====================  ====================  ====================
NumPy                 ✅                     n/a
CuPy                  n/a                   ⛔
PyTorch               ⛔                     ⛔
JAX                   ⛔                     ⛔
Dask                  ⛔                     n/a
====================  ====================  ====================
See
dev-arrayapifor more information.
Examples
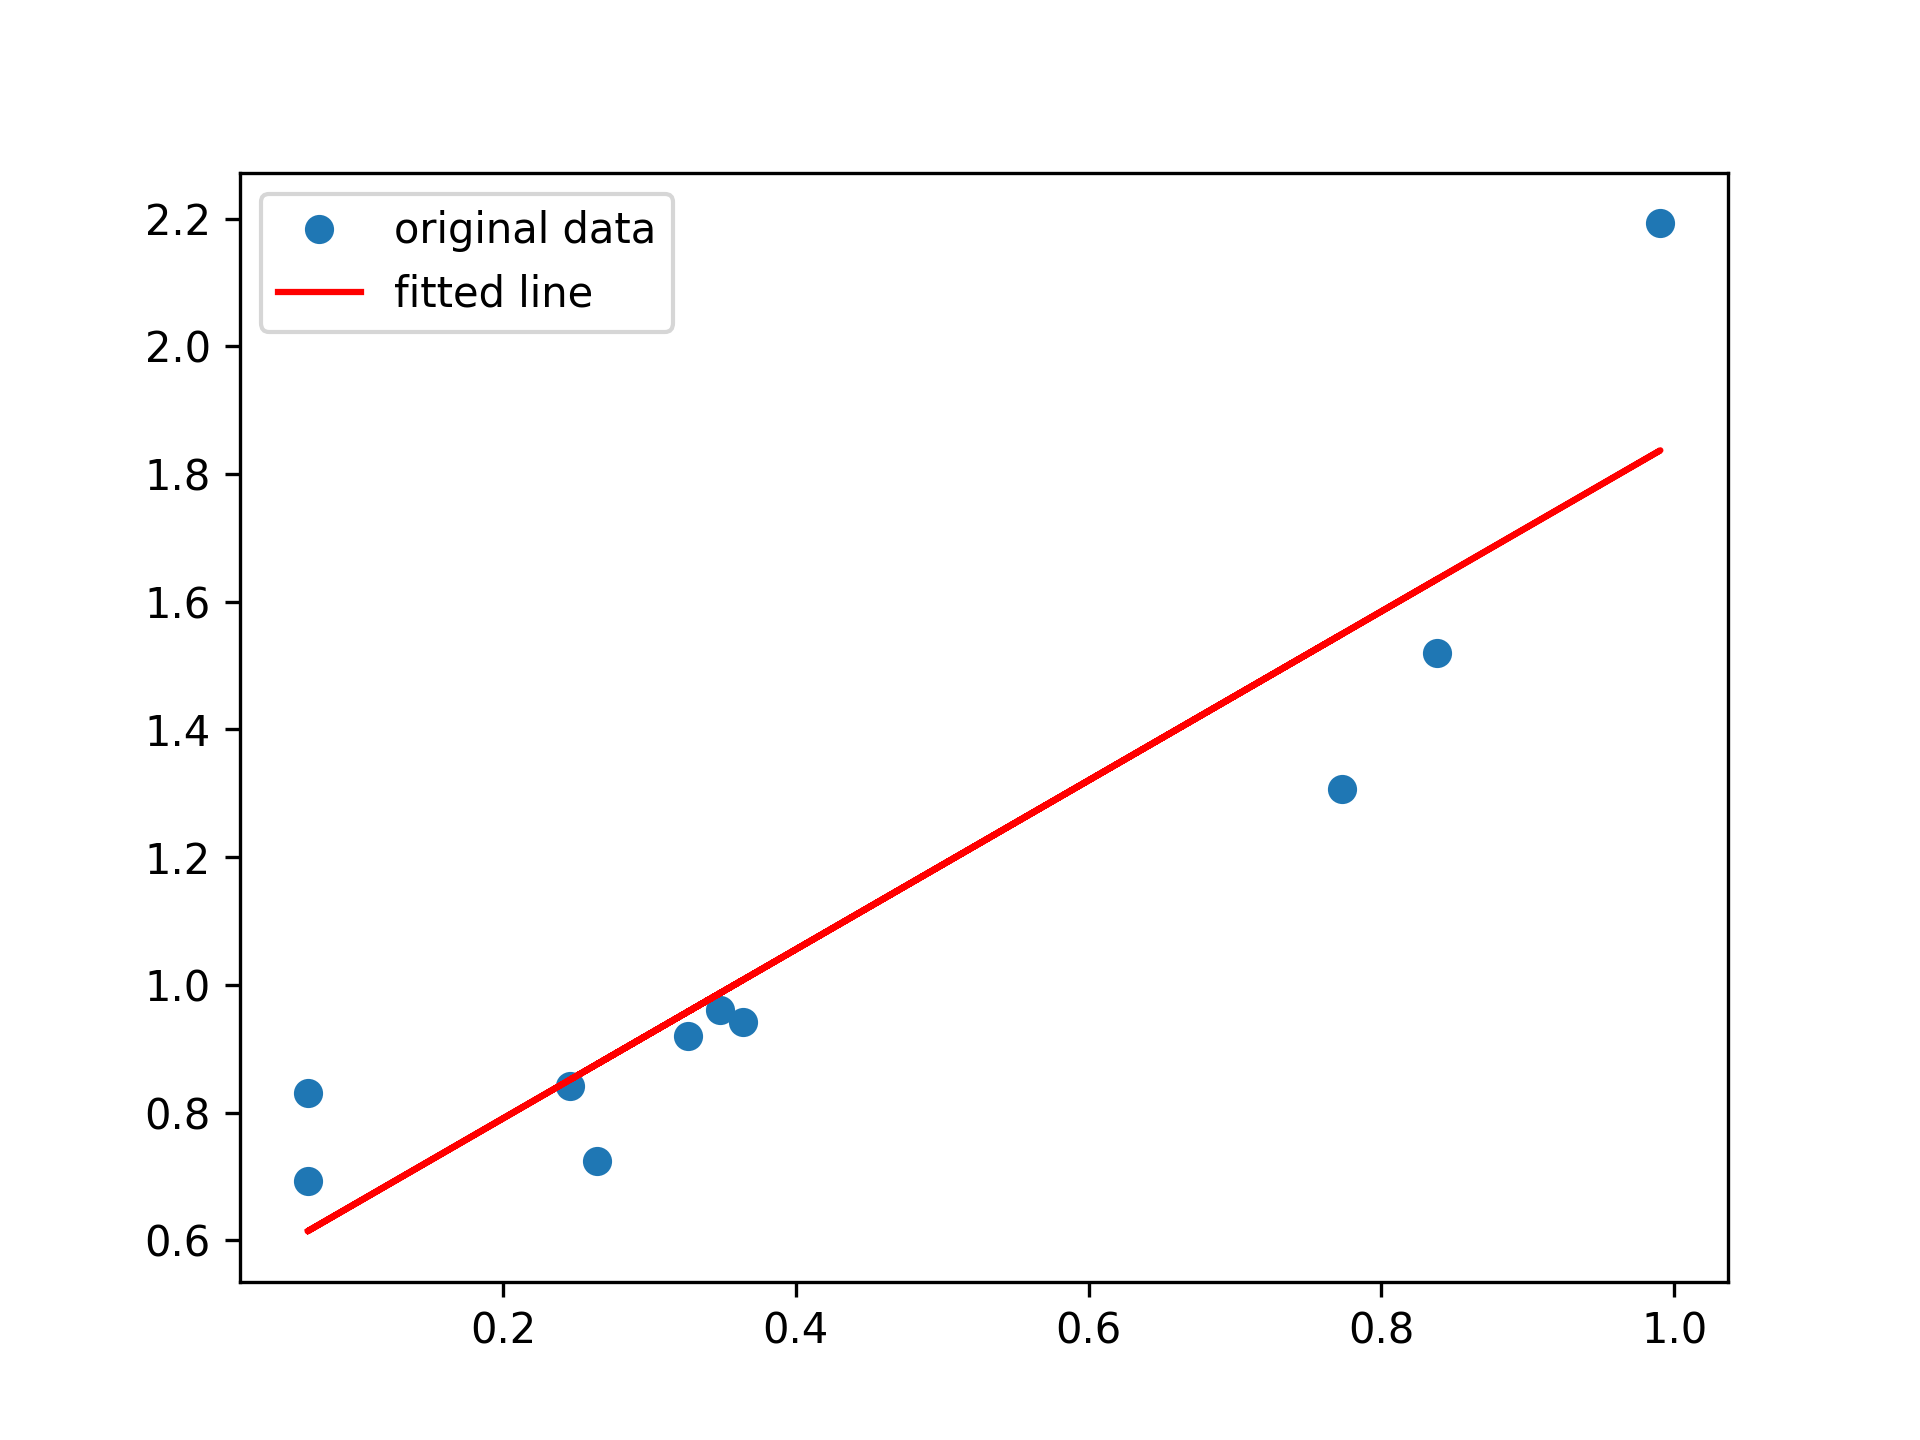
import numpy as np
import matplotlib.pyplot as plt
from scipy import stats
rng = np.random.default_rng()
✓
x = rng.random(10)
y = 1.6*x + rng.random(10)
✓
res = stats.linregress(x, y)
✓print(f"R-squared: {res.rvalue**2:.6f}")
✗plt.plot(x, y, 'o', label='original data') plt.plot(x, res.intercept + res.slope*x, 'r', label='fitted line') plt.legend()✗
plt.show()
✓
from scipy.stats import t
tinv = lambda p, df: abs(t.ppf(p/2, df))
✓
ts = tinv(0.05, len(x)-2)
✓print(f"slope (95%): {res.slope:.6f} +/- {ts*res.stderr:.6f}") print(f"intercept (95%): {res.intercept:.6f}" f" +/- {ts*res.intercept_stderr:.6f}")✗
See also
- scipy.optimize.curve_fit
Use non-linear least squares to fit a function to data.
- scipy.optimize.leastsq
Minimize the sum of squares of a set of equations.
Aliases
-
scipy.stats.linregress