bundles / numpy 2.4.4 / numpy / logspace
_ArrayFunctionDispatcher
numpy:logspace
Signature
def logspace ( start , stop , num = 50 , endpoint = True , base = 10.0 , dtype = None , axis = 0 ) Summary
Return numbers spaced evenly on a log scale.
Extended Summary
In linear space, the sequence starts at base ** start (base to the power of start) and ends with base ** stop (see endpoint below).
Parameters
start: array_likebase ** startis the starting value of the sequence.stop: array_likebase ** stopis the final value of the sequence, unlessendpointis False. In that case,num + 1values are spaced over the interval in log-space, of which all but the last (a sequence of lengthnum) are returned.num: integer, optionalNumber of samples to generate. Default is 50.
endpoint: boolean, optionalIf true,
stopis the last sample. Otherwise, it is not included. Default is True.base: array_like, optionalThe base of the log space. The step size between the elements in
ln(samples) / ln(base)(orlog_base(samples)) is uniform. Default is 10.0.dtype: dtypeThe type of the output array. If
dtypeis not given, the data type is inferred fromstartandstop. The inferred type will never be an integer;floatis chosen even if the arguments would produce an array of integers.axis: int, optionalThe axis in the result to store the samples. Relevant only if start, stop, or base are array-like. By default (0), the samples will be along a new axis inserted at the beginning. Use -1 to get an axis at the end.
Returns
samples: ndarraynumsamples, equally spaced on a log scale.
Notes
If base is a scalar, logspace is equivalent to the code
>>> y = np.linspace(start, stop, num=num, endpoint=endpoint)
... # doctest: +SKIP
>>> power(base, y).astype(dtype)
... # doctest: +SKIP
Examples
import numpy as np
np.logspace(2.0, 3.0, num=4)
✓
np.logspace(2.0, 3.0, num=4, endpoint=False)
np.logspace(2.0, 3.0, num=4, base=2.0)
✗
np.logspace(2.0, 3.0, num=4, base=[2.0, 3.0], axis=-1)
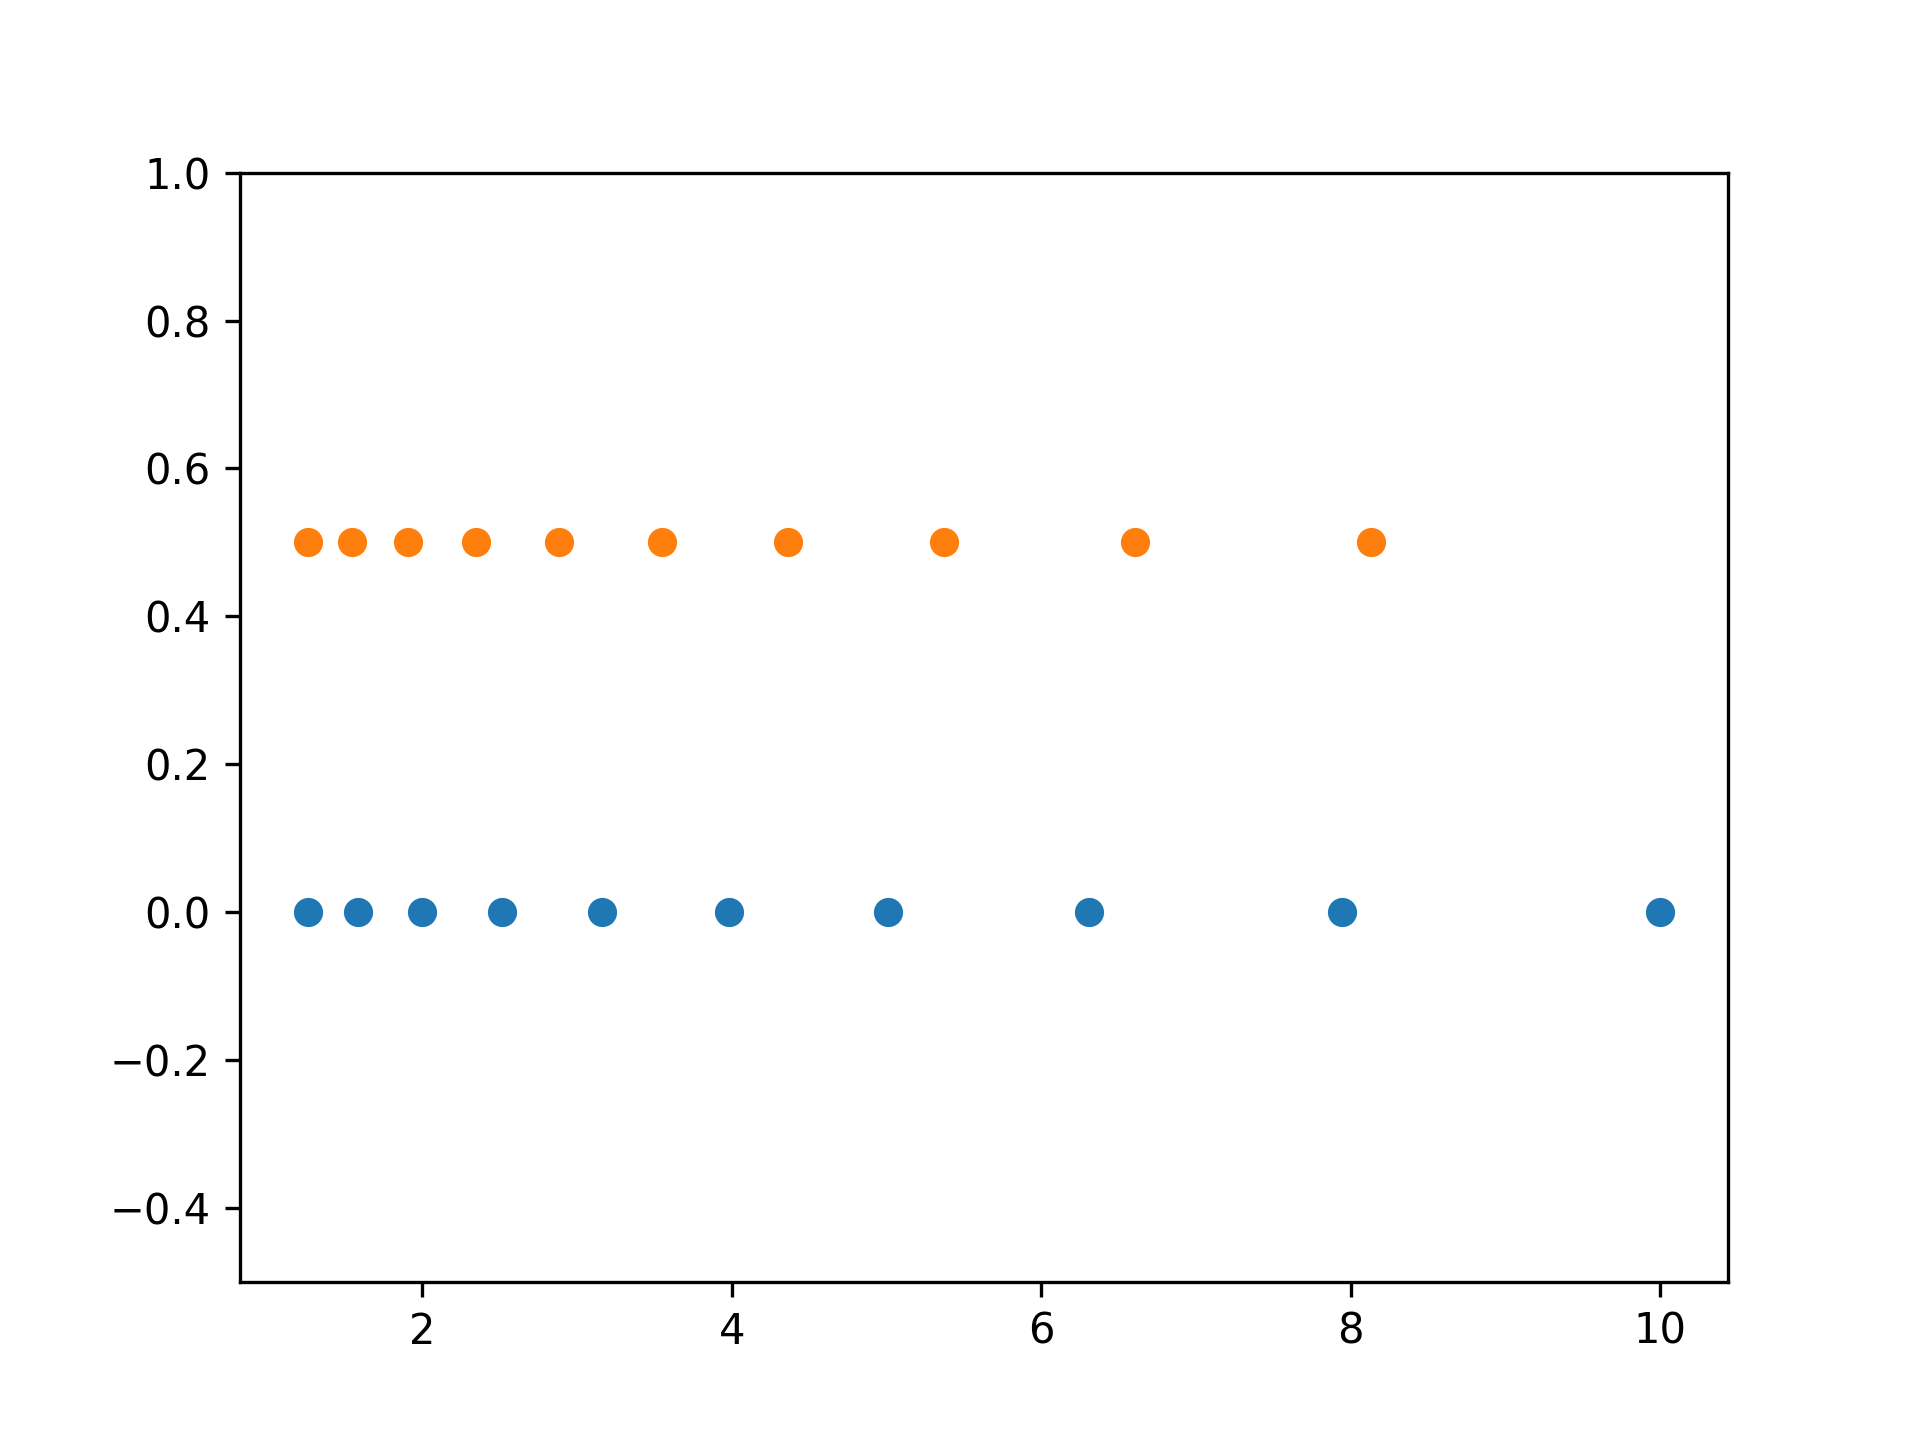
✓import matplotlib.pyplot as plt N = 10 x1 = np.logspace(0.1, 1, N, endpoint=True) x2 = np.logspace(0.1, 1, N, endpoint=False) y = np.zeros(N) plt.plot(x1, y, 'o') plt.plot(x2, y + 0.5, 'o')✓
plt.ylim([-0.5, 1])
✗plt.show()
✓
See also
- arange
Similar to linspace, with the step size specified instead of the number of samples. Note that, when used with a float endpoint, the endpoint may or may not be included.
- geomspace
Similar to logspace, but with endpoints specified directly.
- how-to-partition
ref
- linspace
Similar to logspace, but with the samples uniformly distributed in linear space, instead of log space.
Aliases
-
numpy.logspace