bundles / numpy 2.4.4 / numpy / unwrap
_ArrayFunctionDispatcher
numpy:unwrap
Signature
def unwrap ( p , discont = None , axis = -1 , * , period = 6.283185307179586 ) Summary
Unwrap by taking the complement of large deltas with respect to the period.
Extended Summary
This unwraps a signal p by changing elements which have an absolute difference from their predecessor of more than max(discont, period/2) to their period-complementary values.
For the default case where period is and discont is , this unwraps a radian phase p such that adjacent differences are never greater than by adding for some integer .
Parameters
p: array_likeInput array.
discont: float, optionalMaximum discontinuity between values, default is
period/2. Values belowperiod/2are treated as if they wereperiod/2. To have an effect different from the default,discontshould be larger thanperiod/2.axis: int, optionalAxis along which unwrap will operate, default is the last axis.
period: float, optionalSize of the range over which the input wraps. By default, it is
2 pi.
Returns
out: ndarrayOutput array.
Notes
If the discontinuity in p is smaller than period/2, but larger than discont, no unwrapping is done because taking the complement would only make the discontinuity larger.
Examples
import numpy as np
✓phase = np.linspace(0, np.pi, num=5) phase[3:] += np.pi✓
phase
np.unwrap(phase)
✗
np.unwrap([0, 1, 2, -1, 0], period=4)
np.unwrap([ 1, 2, 3, 4, 5, 6, 1, 2, 3], period=6)
np.unwrap([2, 3, 4, 5, 2, 3, 4, 5], period=4)
phase_deg = np.mod(np.linspace(0 ,720, 19), 360) - 180
np.unwrap(phase_deg, period=360)
✓
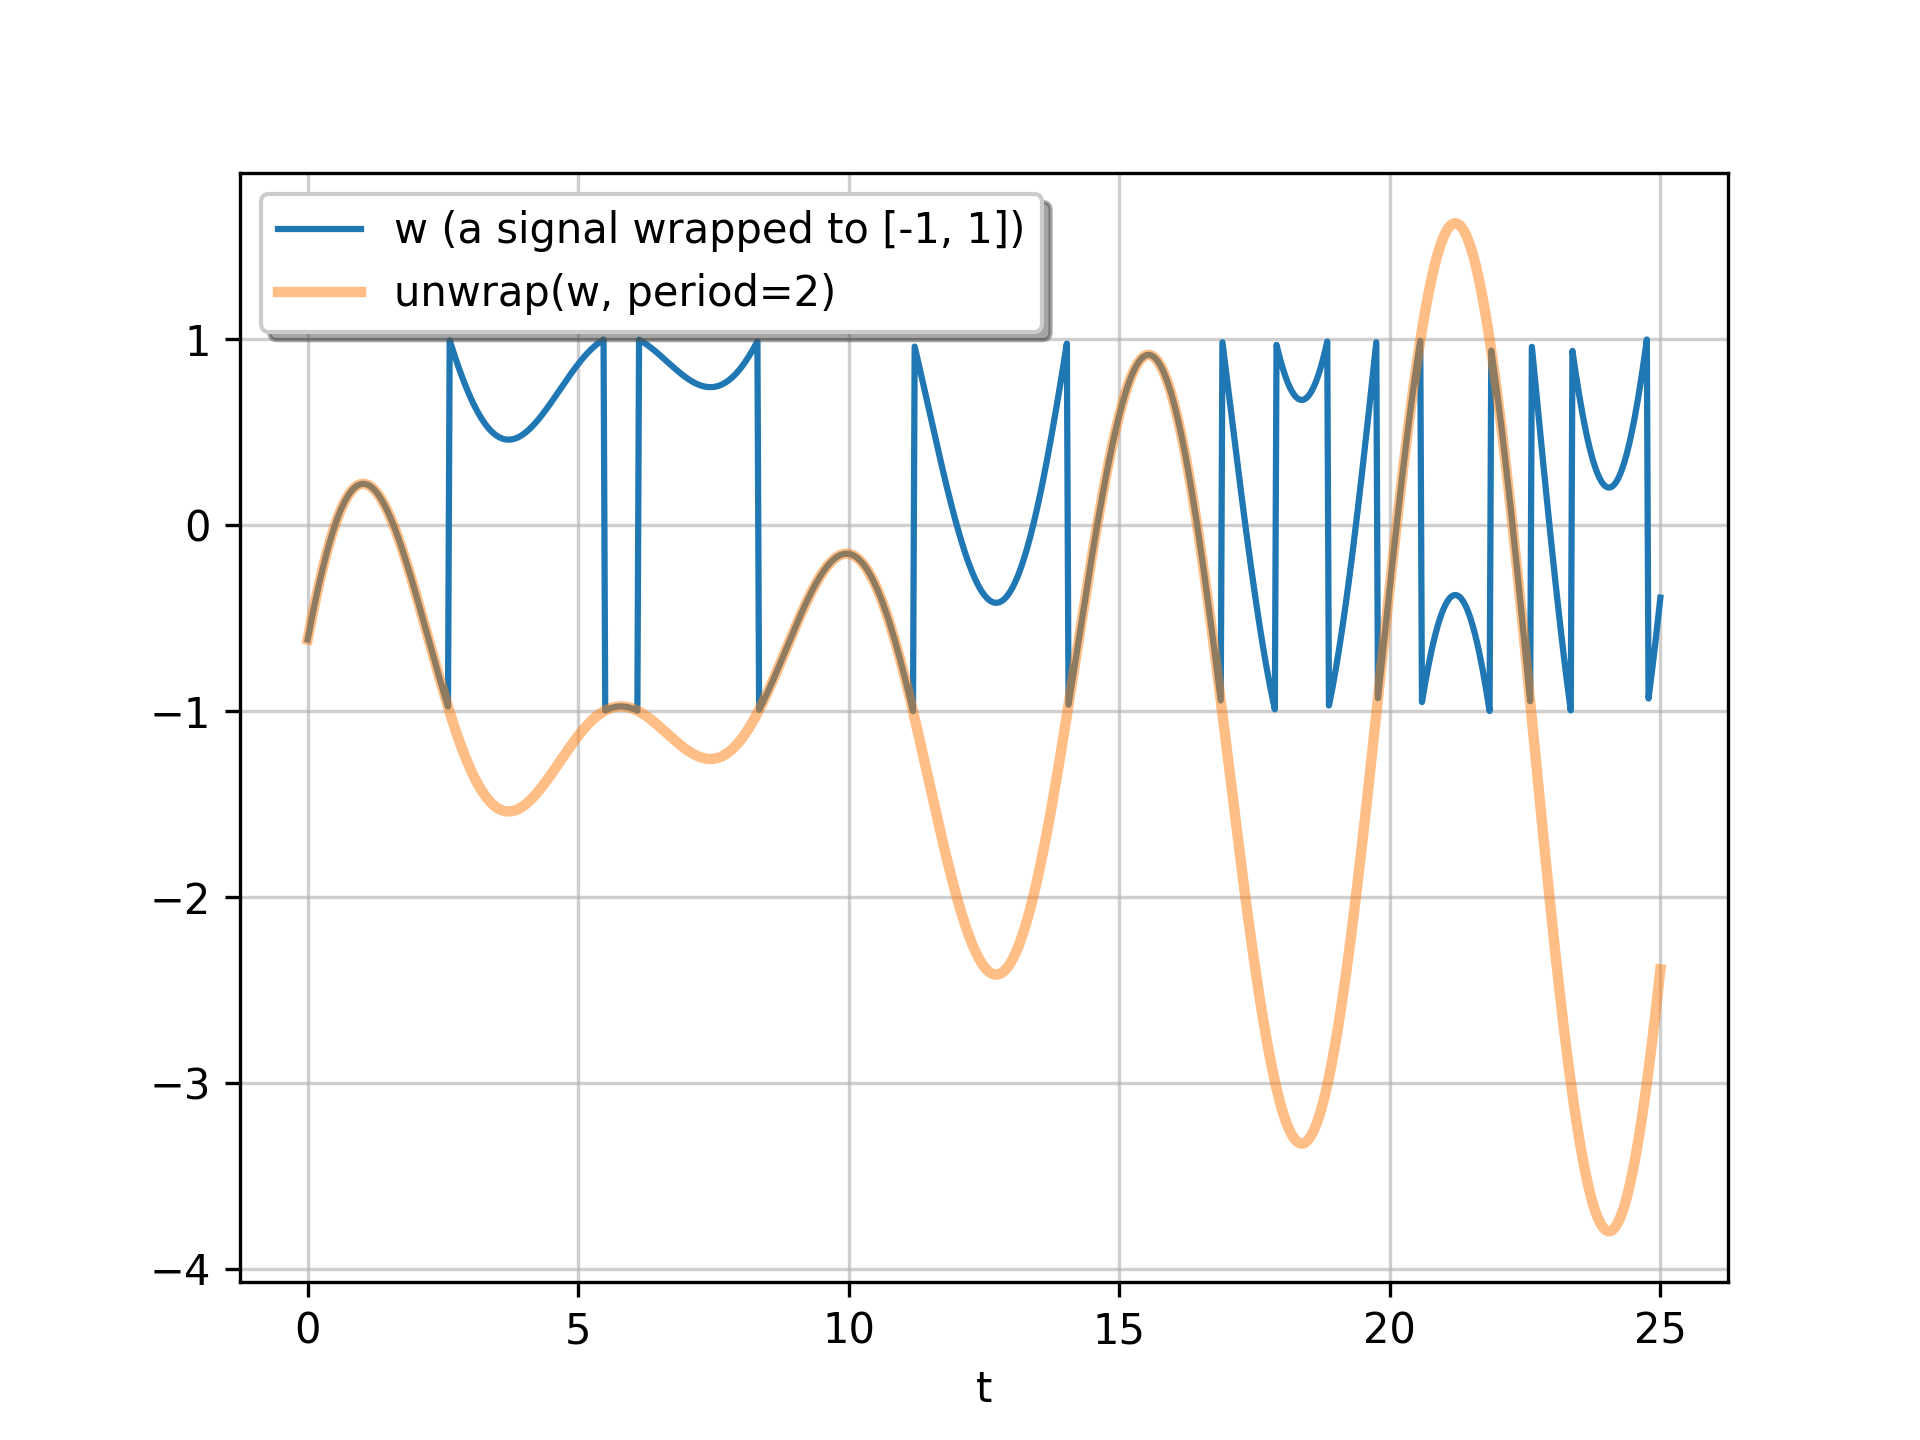
t = np.linspace(0, 25, 801)
w = np.mod(1.5 * np.sin(1.1 * t + 0.26) * (1 - t / 6 + (t / 23) ** 3), 2.0) - 1
u = np.unwrap(w, period=2.0)
✓
import matplotlib.pyplot as plt
✓plt.plot(t, w, label='w (a signal wrapped to [-1, 1])') plt.plot(t, u, linewidth=2.5, alpha=0.5, label='unwrap(w, period=2)') plt.xlabel('t')✗
plt.grid(alpha=0.6)
✓plt.legend(framealpha=1, shadow=True)
✗plt.show()
✓
See also
- deg2rad
- rad2deg
Aliases
-
numpy.unwrap