bundles / numpy 2.5.0.dev0+git20251130.2de293a / numpy / random / RandomState / multivariate_normal
cython_function_or_method
numpy.random:RandomState.multivariate_normal
Signature
def multivariate_normal ( mean , cov , size = None , check_valid = warn , tol = 1e-08 ) Summary
Draw random samples from a multivariate normal distribution.
Extended Summary
The multivariate normal, multinormal or Gaussian distribution is a generalization of the one-dimensional normal distribution to higher dimensions. Such a distribution is specified by its mean and covariance matrix. These parameters are analogous to the mean (average or "center") and variance (standard deviation, or "width," squared) of the one-dimensional normal distribution.
Parameters
mean: 1-D array_like, of length NMean of the N-dimensional distribution.
cov: 2-D array_like, of shape (N, N)Covariance matrix of the distribution. It must be symmetric and positive-semidefinite for proper sampling.
size: int or tuple of ints, optionalGiven a shape of, for example,
(m,n,k),m*n*ksamples are generated, and packed in anm-by-n-by-karrangement. Because each sample isN-dimensional, the output shape is(m,n,k,N). If no shape is specified, a single (N-D) sample is returned.check_valid: { 'warn', 'raise', 'ignore' }, optionalBehavior when the covariance matrix is not positive semidefinite.
tol: float, optionalTolerance when checking the singular values in covariance matrix. cov is cast to double before the check.
Returns
out: ndarrayThe drawn samples, of shape size, if that was provided. If not, the shape is
(N,).In other words, each entry
out[i,j,...,:]is an N-dimensional value drawn from the distribution.
Notes
The mean is a coordinate in N-dimensional space, which represents the location where samples are most likely to be generated. This is analogous to the peak of the bell curve for the one-dimensional or univariate normal distribution.
Covariance indicates the level to which two variables vary together. From the multivariate normal distribution, we draw N-dimensional samples, . The covariance matrix element is the covariance of and . The element is the variance of (i.e. its "spread").
Instead of specifying the full covariance matrix, popular approximations include:
Spherical covariance (
covis a multiple of the identity matrix)Diagonal covariance (
covhas non-negative elements, and only on the diagonal)
This geometrical property can be seen in two dimensions by plotting generated data-points:
>>> mean = [0, 0]
>>> cov = [[1, 0], [0, 100]]  # diagonal covariance
Diagonal covariance means that the variables are independent, and the probability density contours have their axes aligned with the coordinate axes:
>>> import matplotlib.pyplot as plt
>>> x, y = np.random.multivariate_normal(mean, cov, 5000).T
>>> plt.plot(x, y, 'x')
>>> plt.axis('equal')
>>> plt.show()
Note that the covariance matrix must be positive semidefinite (a.k.a. nonnegative-definite). Otherwise, the behavior of this method is undefined and backwards compatibility is not guaranteed.
Examples
mean = (1, 2)
cov = [[1, 0], [0, 1]]
x = np.random.multivariate_normal(mean, cov, (3, 3))
x.shape
✓
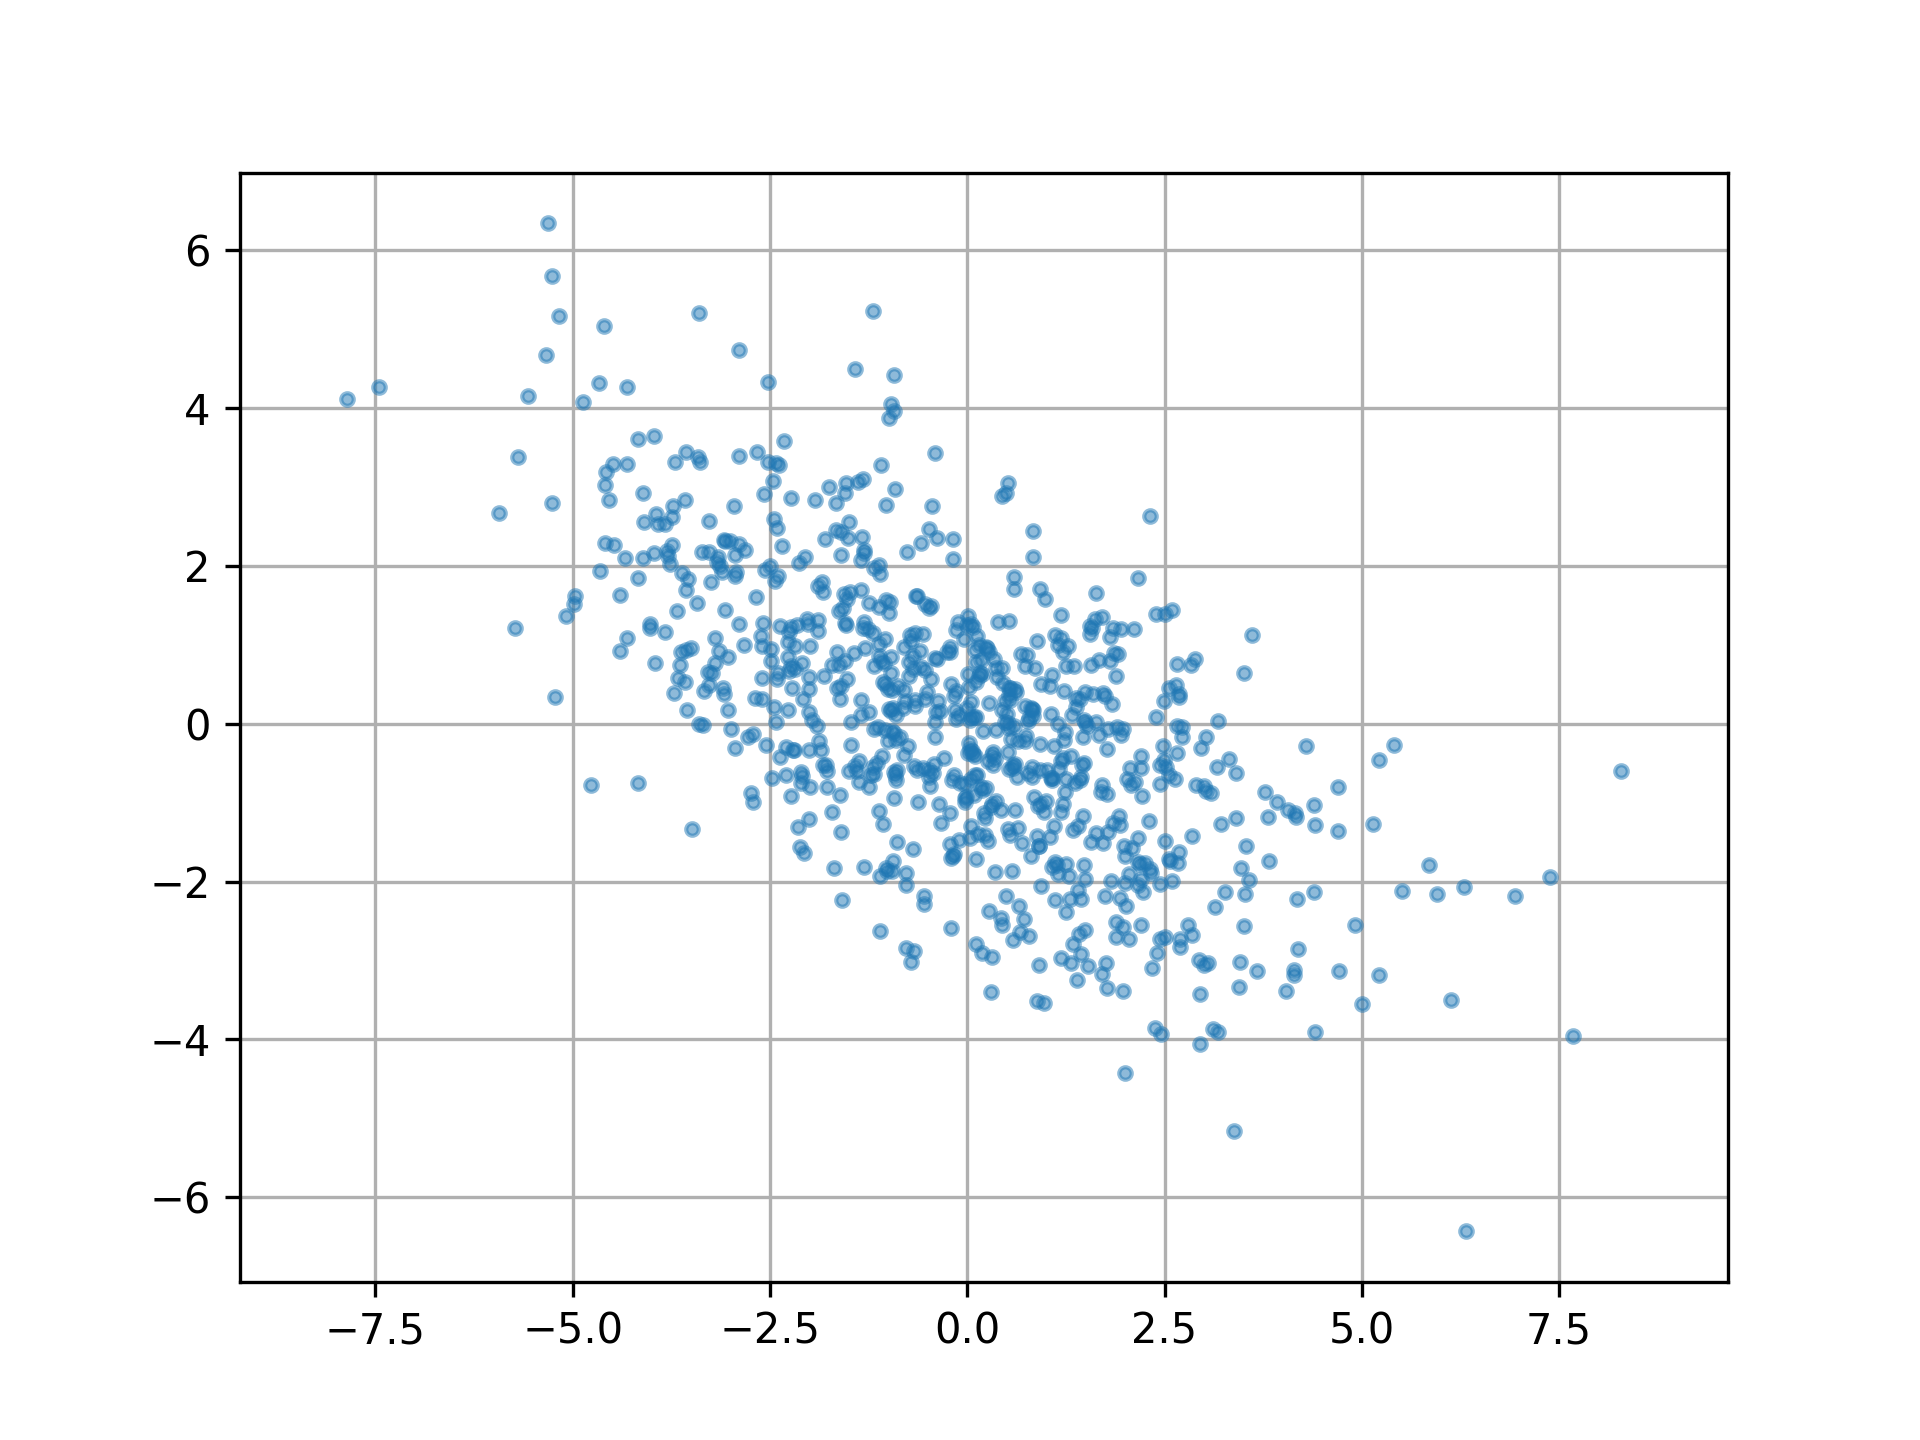
cov = np.array([[6, -3], [-3, 3.5]])
pts = np.random.multivariate_normal([0, 0], cov, size=800)
✓
pts.mean(axis=0)
np.cov(pts.T)
np.corrcoef(pts.T)[0, 1]
✗
import matplotlib.pyplot as plt
✓plt.plot(pts[:, 0], pts[:, 1], '.', alpha=0.5) plt.axis('equal')✗
plt.grid()
plt.show()
✓
See also
- random.Generator.multivariate_normal
which should be used for new code.
Aliases
-
numpy.random.multivariate_normal -
numpy.random.RandomState.multivariate_normal