bundles / numpy latest / numpy / random / RandomState / noncentral_chisquare
cython_function_or_method
numpy.random:RandomState.noncentral_chisquare
Signature
def noncentral_chisquare ( df , nonc , size = None ) Summary
Draw samples from a noncentral chi-square distribution.
Extended Summary
The noncentral distribution is a generalization of the distribution.
Parameters
df: float or array_like of floatsDegrees of freedom, must be > 0.
nonc: float or array_like of floatsNon-centrality, must be non-negative.
size: int or tuple of ints, optionalOutput shape. If the given shape is, e.g.,
(m, n, k), thenm * n * ksamples are drawn. If size isNone(default), a single value is returned ifdfandnoncare both scalars. Otherwise,np.broadcast(df, nonc).sizesamples are drawn.
Returns
out: ndarray or scalarDrawn samples from the parameterized noncentral chi-square distribution.
Notes
The probability density function for the noncentral Chi-square distribution is
where is the Chi-square with q degrees of freedom.
Examples
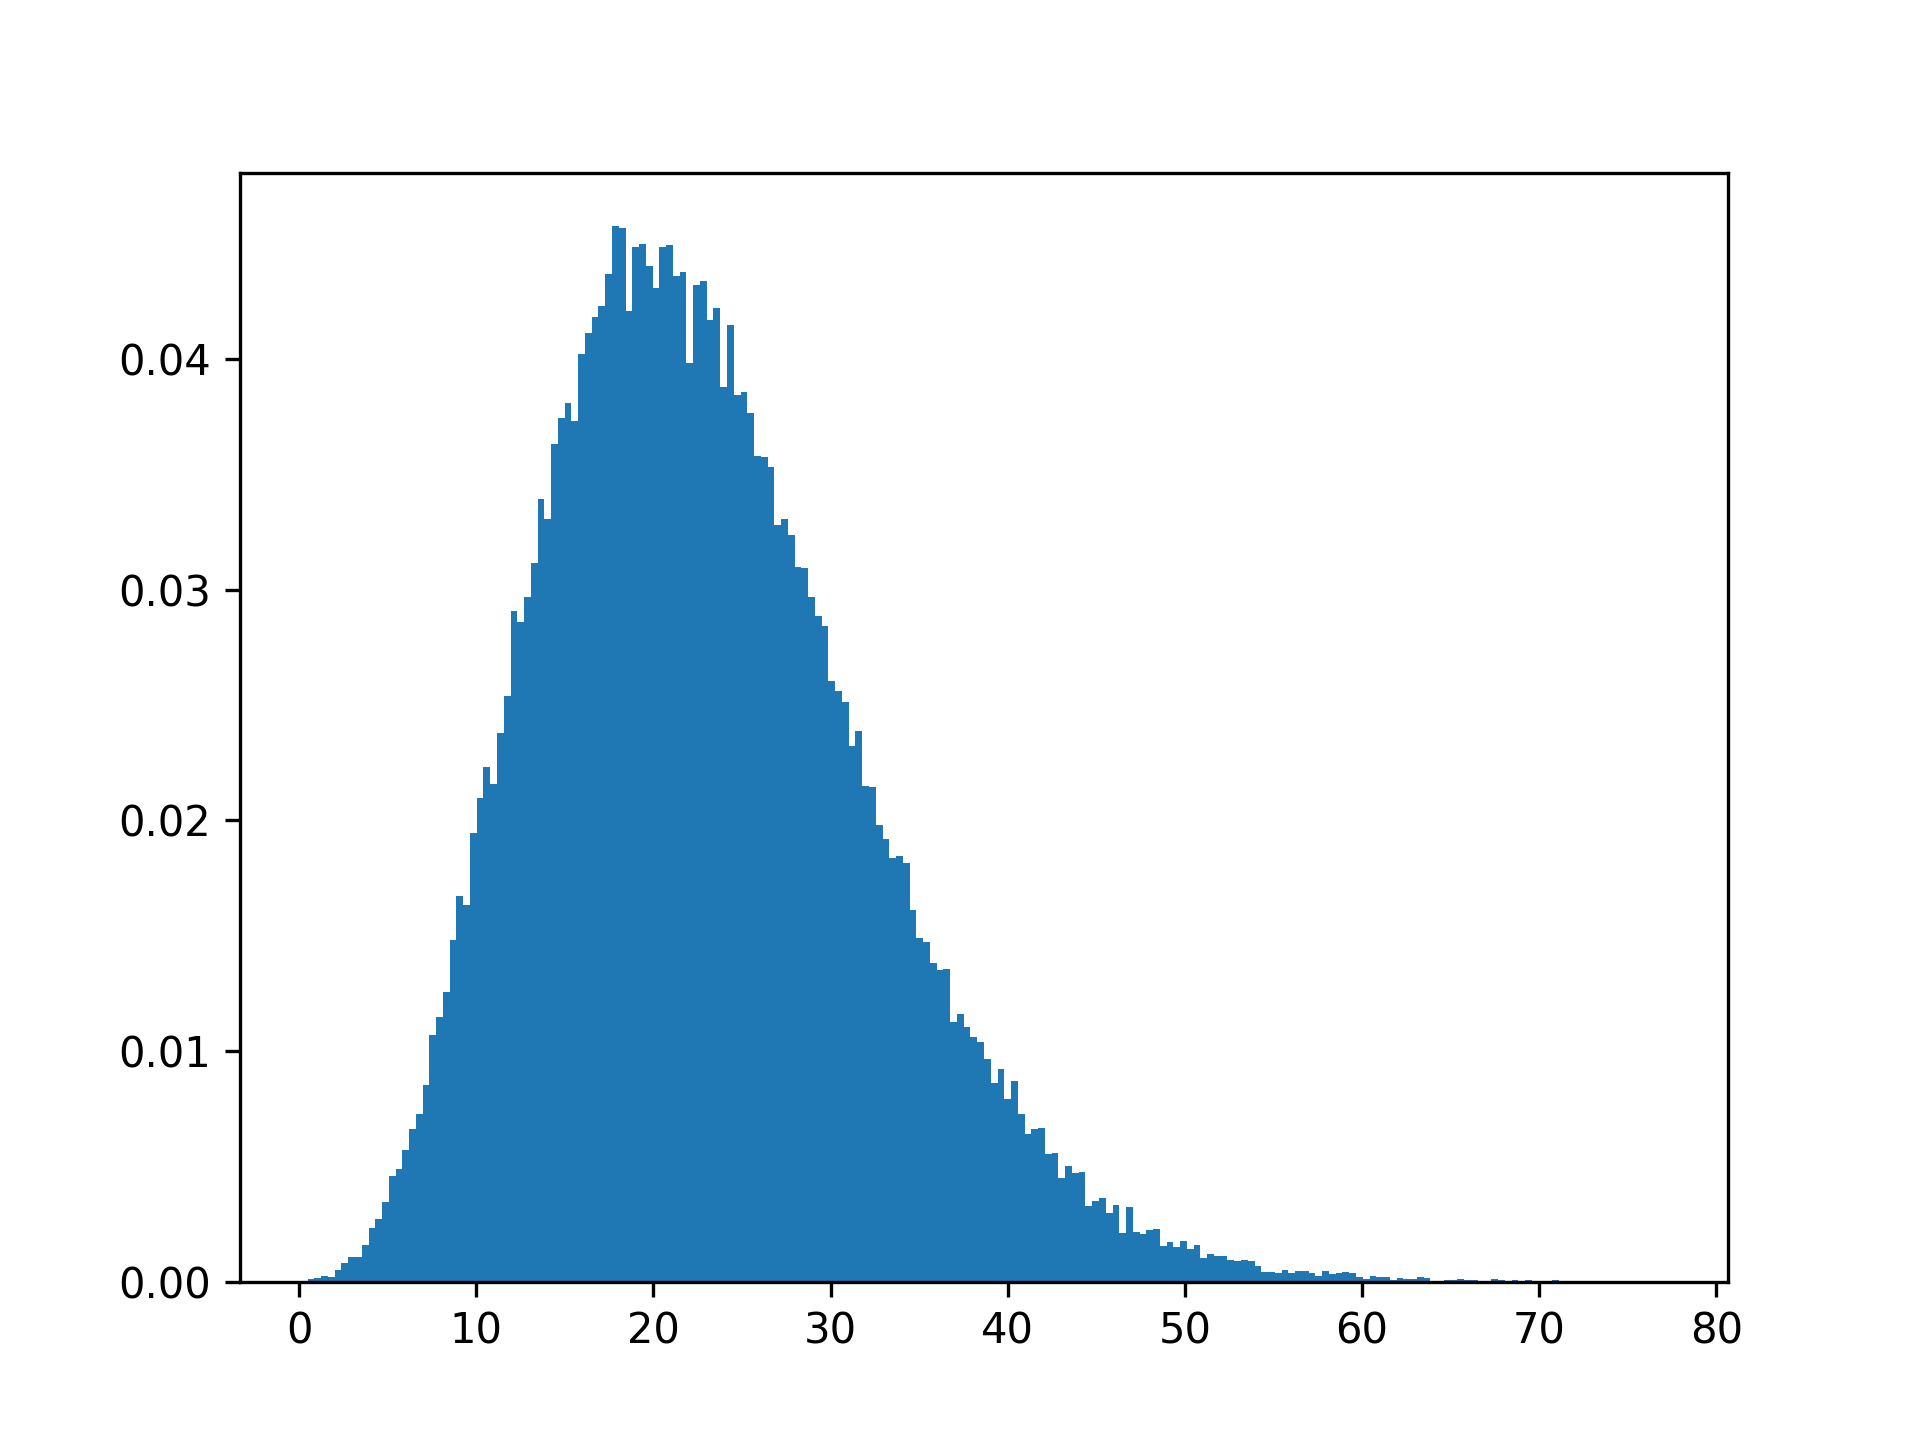
Draw values from the distribution and plot the histogramimport matplotlib.pyplot as plt values = plt.hist(np.random.noncentral_chisquare(3, 20, 100000), bins=200, density=True) plt.show()✓
plt.figure()
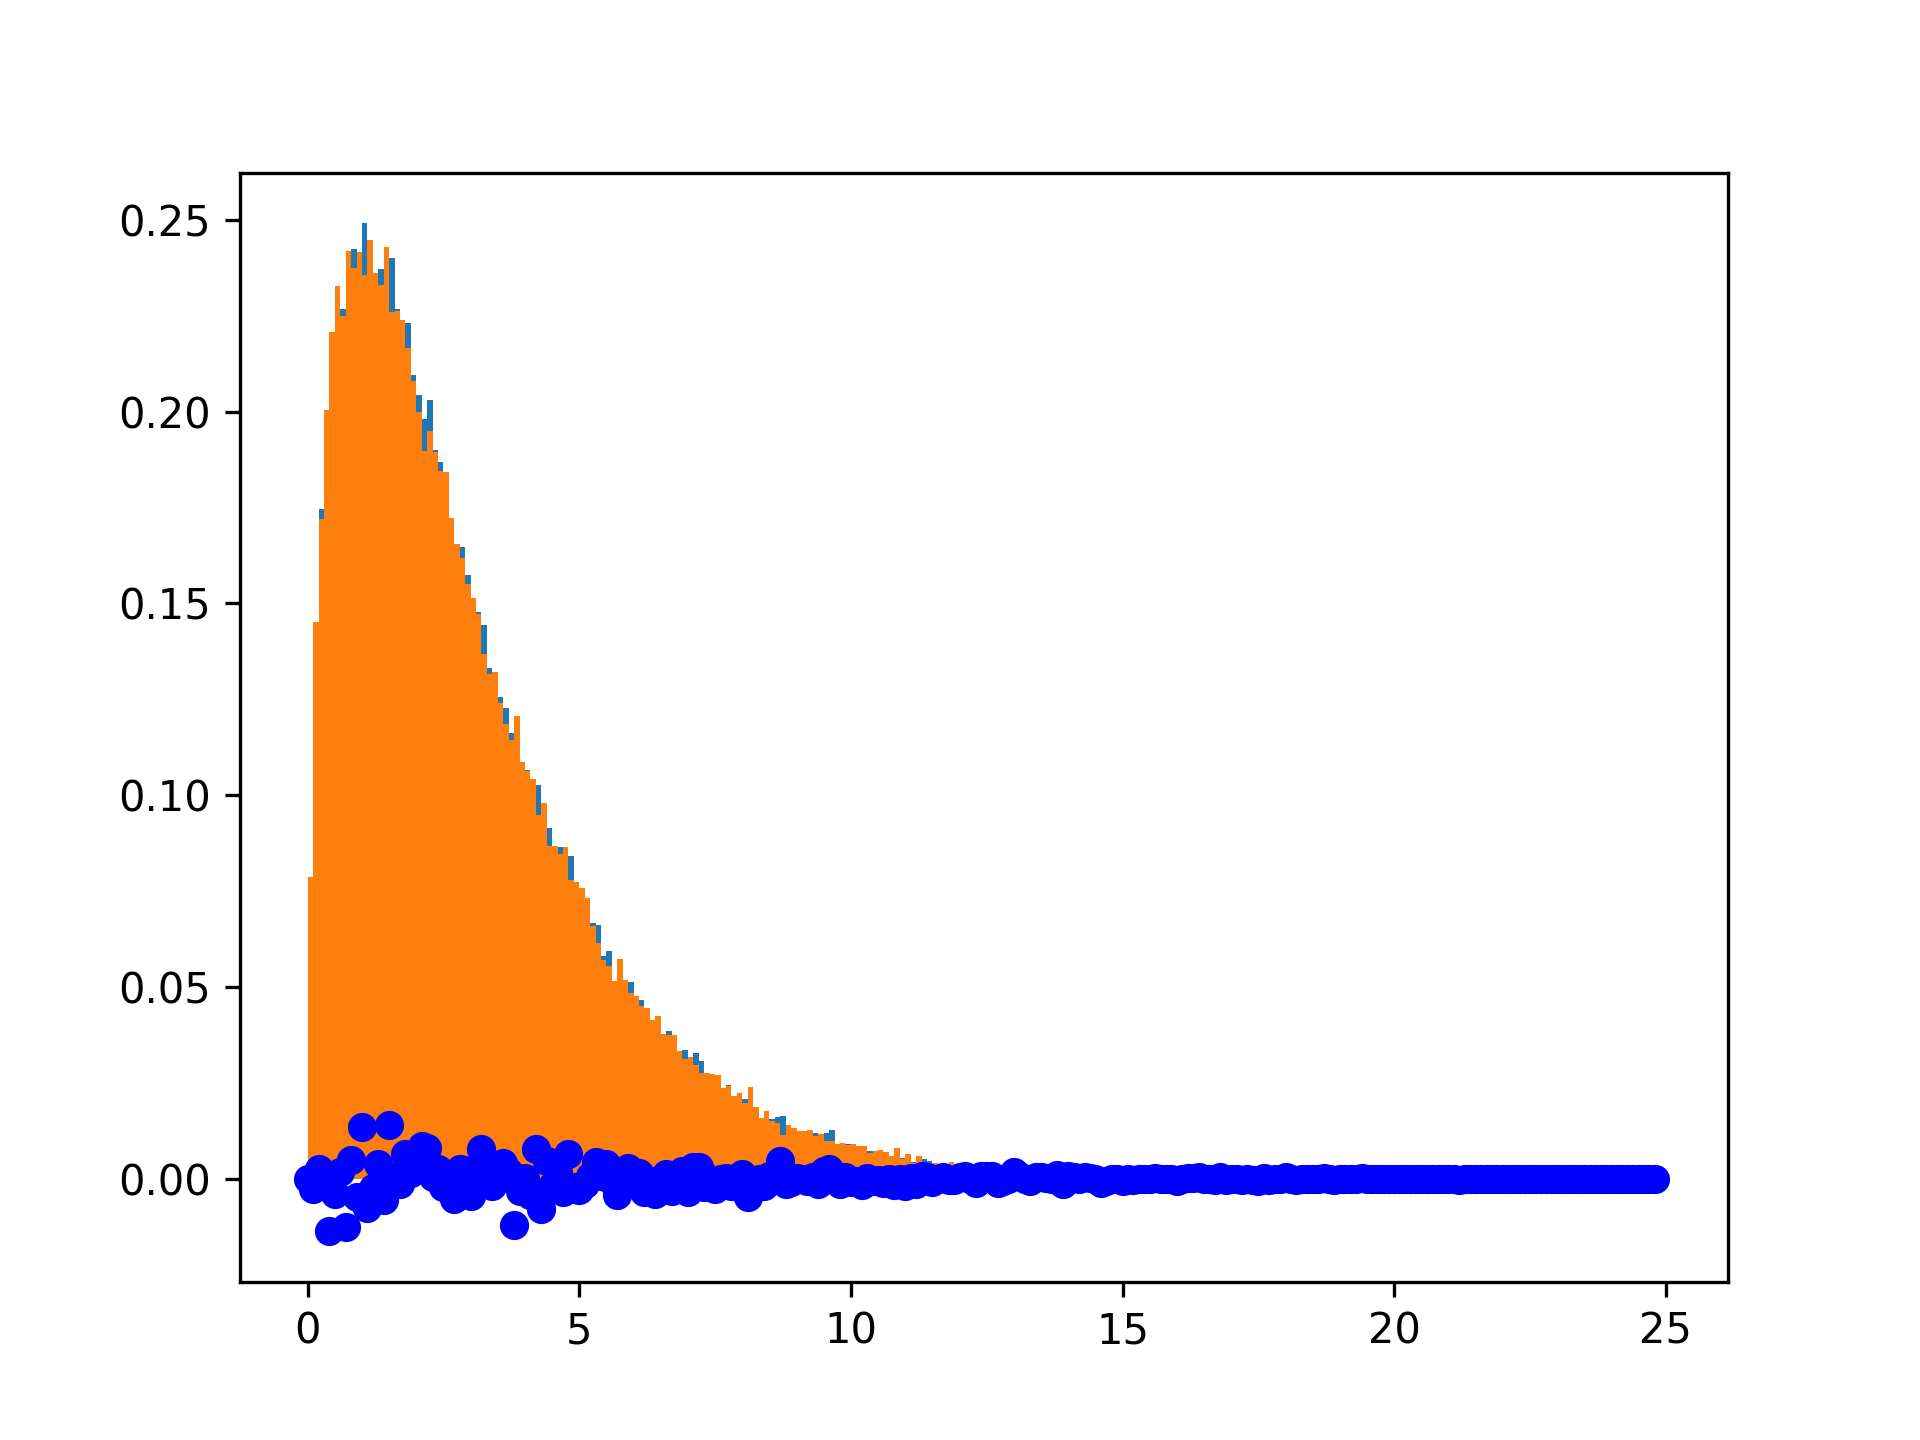
✗values = plt.hist(np.random.noncentral_chisquare(3, .0000001, 100000), bins=np.arange(0., 25, .1), density=True) values2 = plt.hist(np.random.chisquare(3, 100000), bins=np.arange(0., 25, .1), density=True)✓
plt.plot(values[1][0:-1], values[0]-values2[0], 'ob')
✗plt.show()
✓
plt.figure()
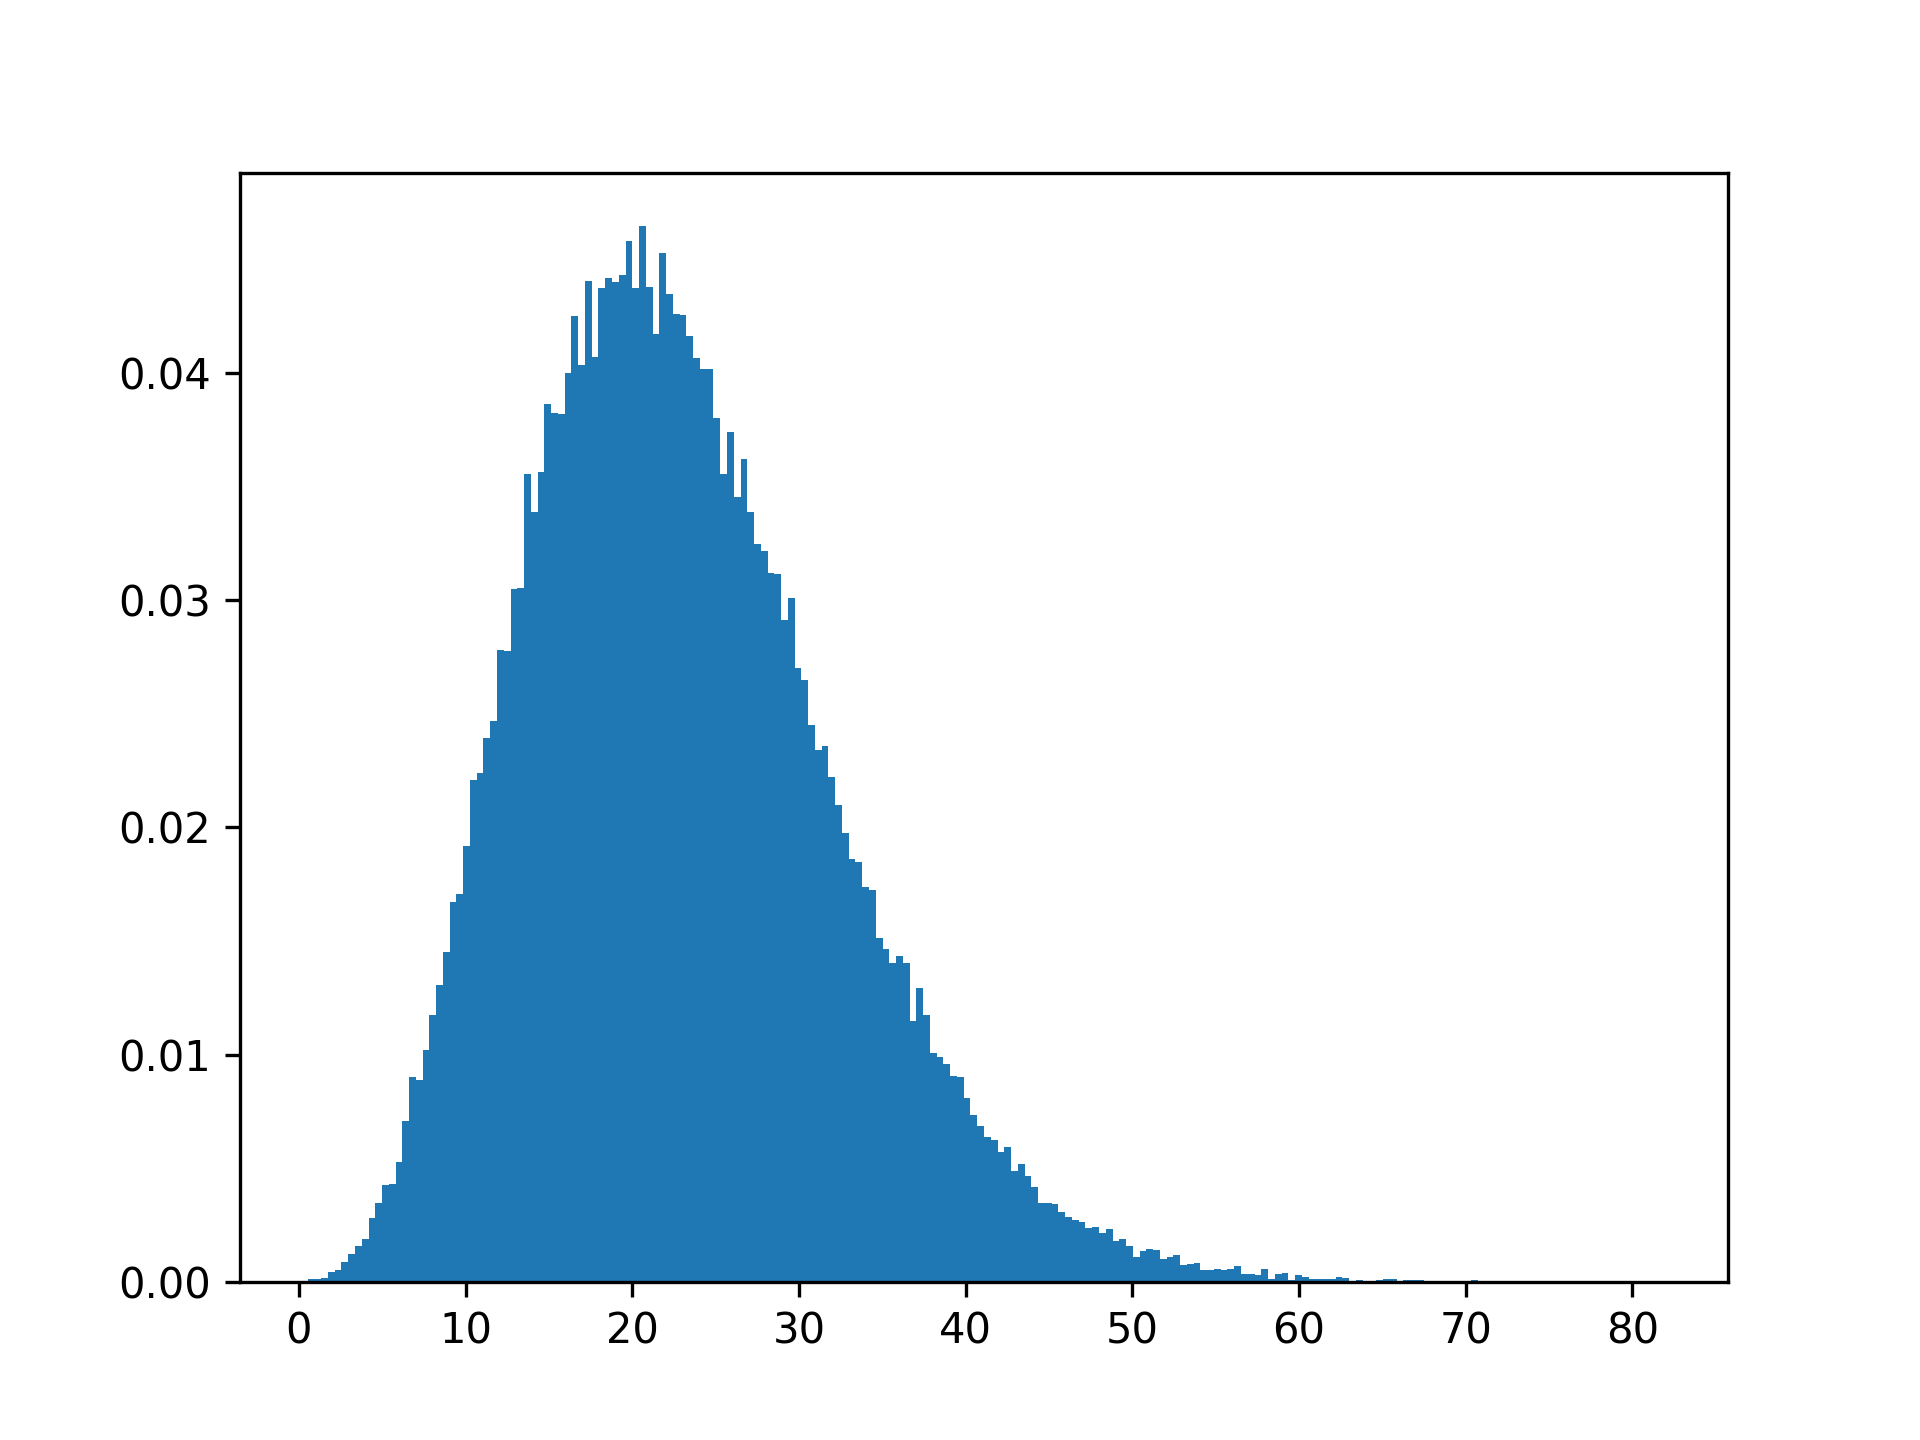
✗values = plt.hist(np.random.noncentral_chisquare(3, 20, 100000), bins=200, density=True) plt.show()✓
See also
- random.Generator.noncentral_chisquare
which should be used for new code.
Aliases
-
numpy.random.noncentral_chisquare -
numpy.random.RandomState.noncentral_chisquare