bundles / scipy 1.17.1 / scipy / stats / _morestats / bayes_mvs
function
scipy.stats._morestats:bayes_mvs
source: /scipy/stats/_morestats.py :62
Signature
def bayes_mvs ( data , alpha = 0.9 ) Summary
Bayesian confidence intervals for the mean, var, and std.
Parameters
data: array_likeInput data, if multi-dimensional it is flattened to 1-D by bayes_mvs. Requires 2 or more data points.
alpha: float, optionalProbability that the returned confidence interval contains the true parameter.
Returns
mean_cntr, var_cntr, std_cntr: tupleThe three results are for the mean, variance and standard deviation, respectively. Each result is a tuple of the form
(center, (lower, upper))with
centerthe mean of the conditional pdf of the value given the data, and(lower, upper)a confidence interval, centered on the median, containing the estimate to a probabilityalpha.
Notes
Each tuple of mean, variance, and standard deviation estimates represent the (center, (lower, upper)) with center the mean of the conditional pdf of the value given the data and (lower, upper) is a confidence interval centered on the median, containing the estimate to a probability alpha.
Converts data to 1-D and assumes all data has the same mean and variance. Uses Jeffrey's prior for variance and std.
Equivalent to tuple((x.mean(), x.interval(alpha)) for x in mvsdist(dat))
Array API Standard Support
bayes_mvs has experimental support for Python Array API Standard compatible backends in addition to NumPy. Please consider testing these features by setting an environment variable SCIPY_ARRAY_API=1 and providing CuPy, PyTorch, JAX, or Dask arrays as array arguments. The following combinations of backend and device (or other capability) are supported.
====================  ====================  ====================
Library               CPU                   GPU
====================  ====================  ====================
NumPy                 ✅                     n/a
CuPy                  n/a                   ⛔
PyTorch               ⛔                     ⛔
JAX                   ⛔                     ⛔
Dask                  ⛔                     n/a
====================  ====================  ====================
See
dev-arrayapifor more information.
Examples
First a basic example to demonstrate the outputs:from scipy import stats data = [6, 9, 12, 7, 8, 8, 13] mean, var, std = stats.bayes_mvs(data)✓
mean
var
std
✗
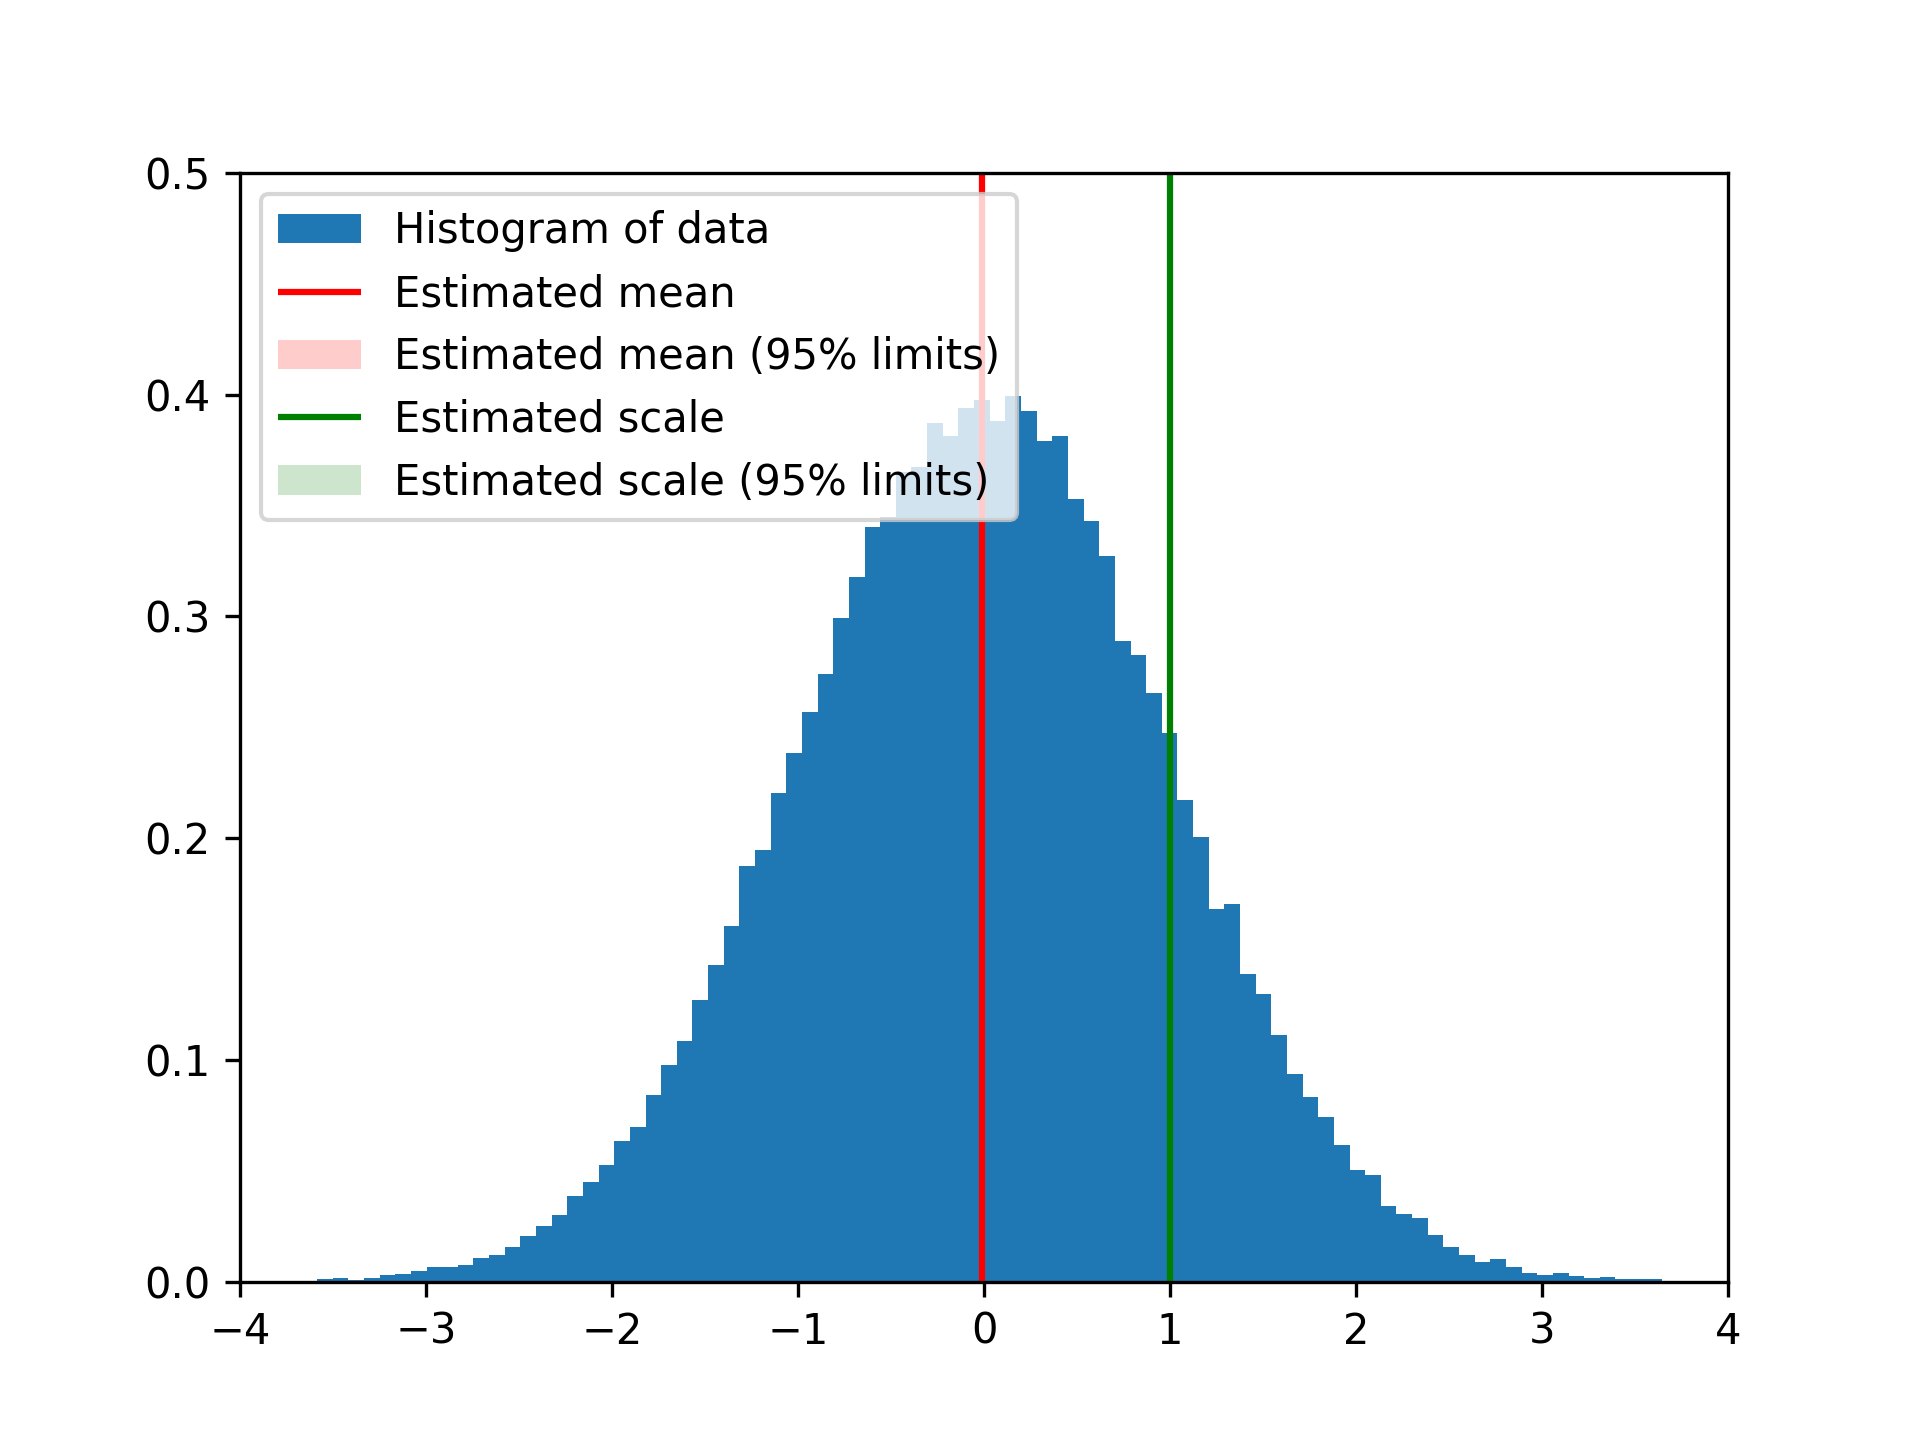
n_samples = 100000
data = stats.norm.rvs(size=n_samples)
res_mean, res_var, res_std = stats.bayes_mvs(data, alpha=0.95)
✓
import matplotlib.pyplot as plt
fig = plt.figure()
ax = fig.add_subplot(111)
✓
ax.hist(data, bins=100, density=True, label='Histogram of data')
ax.vlines(res_mean.statistic, 0, 0.5, colors='r', label='Estimated mean')
ax.axvspan(res_mean.minmax[0],res_mean.minmax[1], facecolor='r',
           alpha=0.2, label=r'Estimated mean (95% limits)')
ax.vlines(res_std.statistic, 0, 0.5, colors='g', label='Estimated scale')
ax.axvspan(res_std.minmax[0],res_std.minmax[1], facecolor='g', alpha=0.2,
           label=r'Estimated scale (95% limits)')
✗
ax.legend(fontsize=10)
ax.set_xlim([-4, 4])
ax.set_ylim([0, 0.5])
✗
plt.show()
✓
See also
Aliases
-
scipy.stats.bayes_mvs