bundles / scipy 1.17.1 / scipy / stats / _morestats / yeojohnson
function
scipy.stats._morestats:yeojohnson
source: /scipy/stats/_morestats.py :1574
Signature
def yeojohnson ( x , lmbda = None ) Summary
Return a dataset transformed by a Yeo-Johnson power transformation.
Parameters
x: ndarrayInput array. Should be 1-dimensional.
lmbda: float, optionalIf
lmbdaisNone, find the lambda that maximizes the log-likelihood function and return it as the second output argument. Otherwise the transformation is done for the given value.
Returns
: yeojohnson: ndarrayYeo-Johnson power transformed array.
maxlog: float, optionalIf the
lmbdaparameter is None, the second returned argument is the lambda that maximizes the log-likelihood function.
Notes
The Yeo-Johnson transform is given by:
Unlike boxcox, yeojohnson does not require the input data to be positive.
Array API Standard Support
yeojohnson has experimental support for Python Array API Standard compatible backends in addition to NumPy. Please consider testing these features by setting an environment variable SCIPY_ARRAY_API=1 and providing CuPy, PyTorch, JAX, or Dask arrays as array arguments. The following combinations of backend and device (or other capability) are supported.
====================  ====================  ====================
Library               CPU                   GPU
====================  ====================  ====================
NumPy                 ✅                     n/a
CuPy                  n/a                   ⛔
PyTorch               ⛔                     ⛔
JAX                   ⛔                     ⛔
Dask                  ⛔                     n/a
====================  ====================  ====================
See
dev-arrayapifor more information.
Examples
from scipy import stats
import matplotlib.pyplot as plt
✓
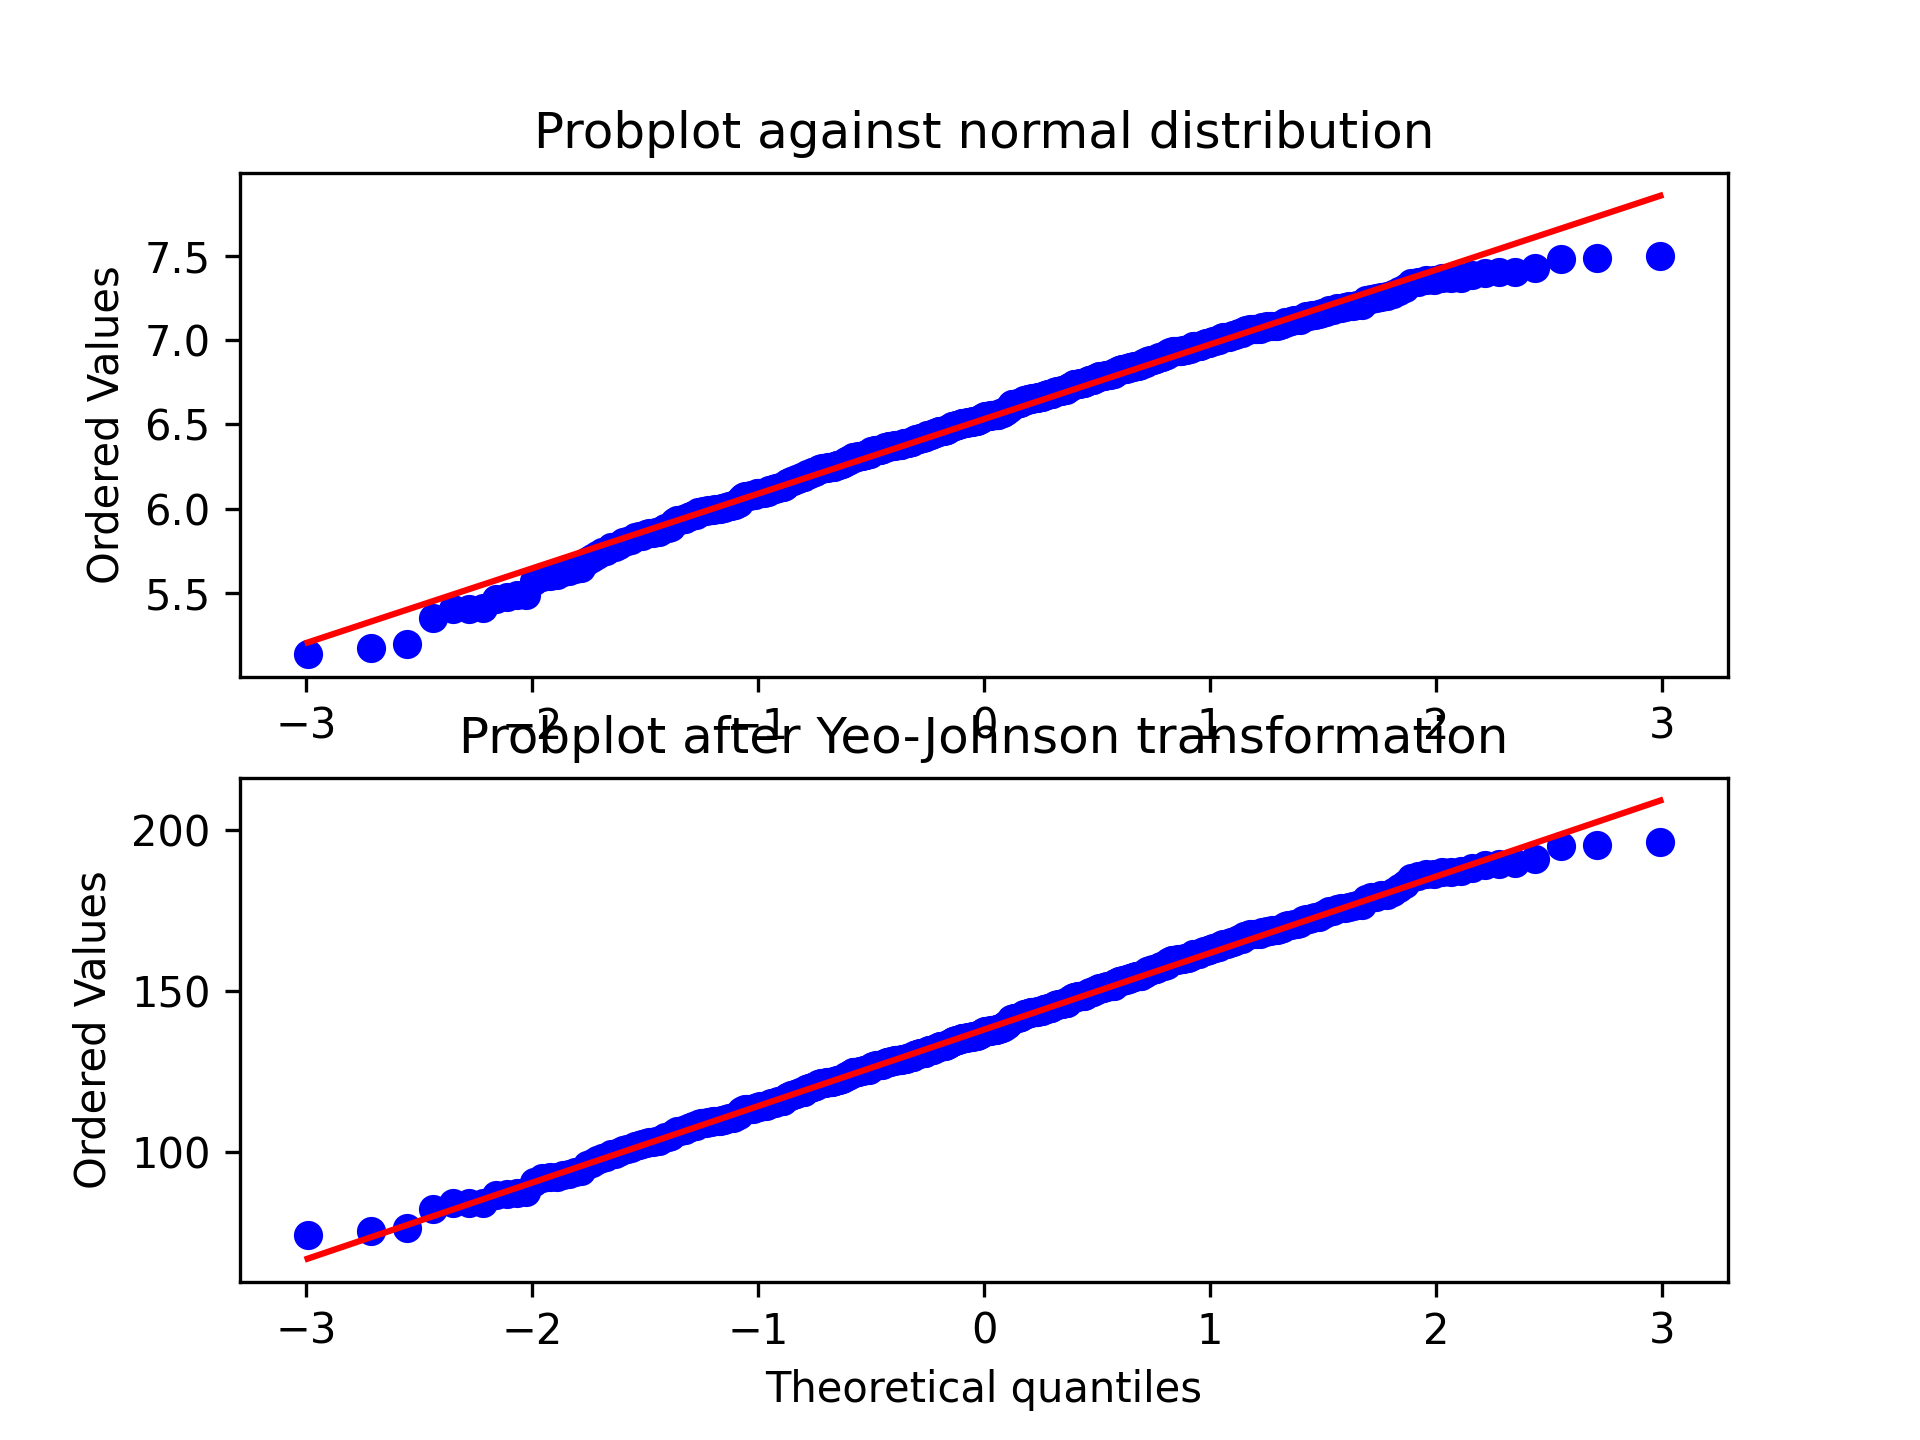
fig = plt.figure()
ax1 = fig.add_subplot(211)
x = stats.loggamma.rvs(5, size=500) + 5
prob = stats.probplot(x, dist=stats.norm, plot=ax1)
✓
ax1.set_xlabel('')
ax1.set_title('Probplot against normal distribution')
✗
ax2 = fig.add_subplot(212)
xt, lmbda = stats.yeojohnson(x)
prob = stats.probplot(xt, dist=stats.norm, plot=ax2)
✓
ax2.set_title('Probplot after Yeo-Johnson transformation')
✗plt.show()
✓
See also
Aliases
-
scipy.stats.yeojohnson