bundles / scipy 1.17.1 / scipy / stats / _morestats / ppcc_plot
function
scipy.stats._morestats:ppcc_plot
source: /scipy/stats/_morestats.py :772
Signature
def ppcc_plot ( x , a , b , dist = tukeylambda , plot = None , N = 80 ) Summary
Calculate and optionally plot probability plot correlation coefficient.
Extended Summary
The probability plot correlation coefficient (PPCC) plot can be used to determine the optimal shape parameter for a one-parameter family of distributions. It cannot be used for distributions without shape parameters (like the normal distribution) or with multiple shape parameters.
By default a Tukey-Lambda distribution (stats.tukeylambda) is used. A Tukey-Lambda PPCC plot interpolates from long-tailed to short-tailed distributions via an approximately normal one, and is therefore particularly useful in practice.
Parameters
x: array_likeInput array.
a, b: scalarLower and upper bounds of the shape parameter to use.
dist: str or stats.distributions instance, optionalDistribution or distribution function name. Objects that look enough like a stats.distributions instance (i.e. they have a
ppfmethod) are also accepted. The default is'tukeylambda'.plot: object, optionalIf given, plots PPCC against the shape parameter.
plotis an object that has to have methods "plot" and "text". The matplotlib.pyplot module or a Matplotlib Axes object can be used, or a custom object with the same methods. Default is None, which means that no plot is created.N: int, optionalNumber of points on the horizontal axis (equally distributed from
atob).
Returns
svals: ndarrayThe shape values for which ppcc was calculated.
ppcc: ndarrayThe calculated probability plot correlation coefficient values.
Notes
Array API Standard Support
ppcc_plot has experimental support for Python Array API Standard compatible backends in addition to NumPy. Please consider testing these features by setting an environment variable SCIPY_ARRAY_API=1 and providing CuPy, PyTorch, JAX, or Dask arrays as array arguments. The following combinations of backend and device (or other capability) are supported.
====================  ====================  ====================
Library               CPU                   GPU
====================  ====================  ====================
NumPy                 ✅                     n/a
CuPy                  n/a                   ⛔
PyTorch               ⛔                     ⛔
JAX                   ⛔                     ⛔
Dask                  ⛔                     n/a
====================  ====================  ====================
See
dev-arrayapifor more information.
Examples
First we generate some random data from a Weibull distribution with shape parameter 2.5, and plot the histogram of the data:import numpy as np from scipy import stats import matplotlib.pyplot as plt rng = np.random.default_rng() c = 2.5 x = stats.weibull_min.rvs(c, scale=4, size=2000, random_state=rng)✓
fig1, ax = plt.subplots(figsize=(9, 4))
✓ax.hist(x, bins=50) ax.set_title('Histogram of x')✗
plt.show()
✓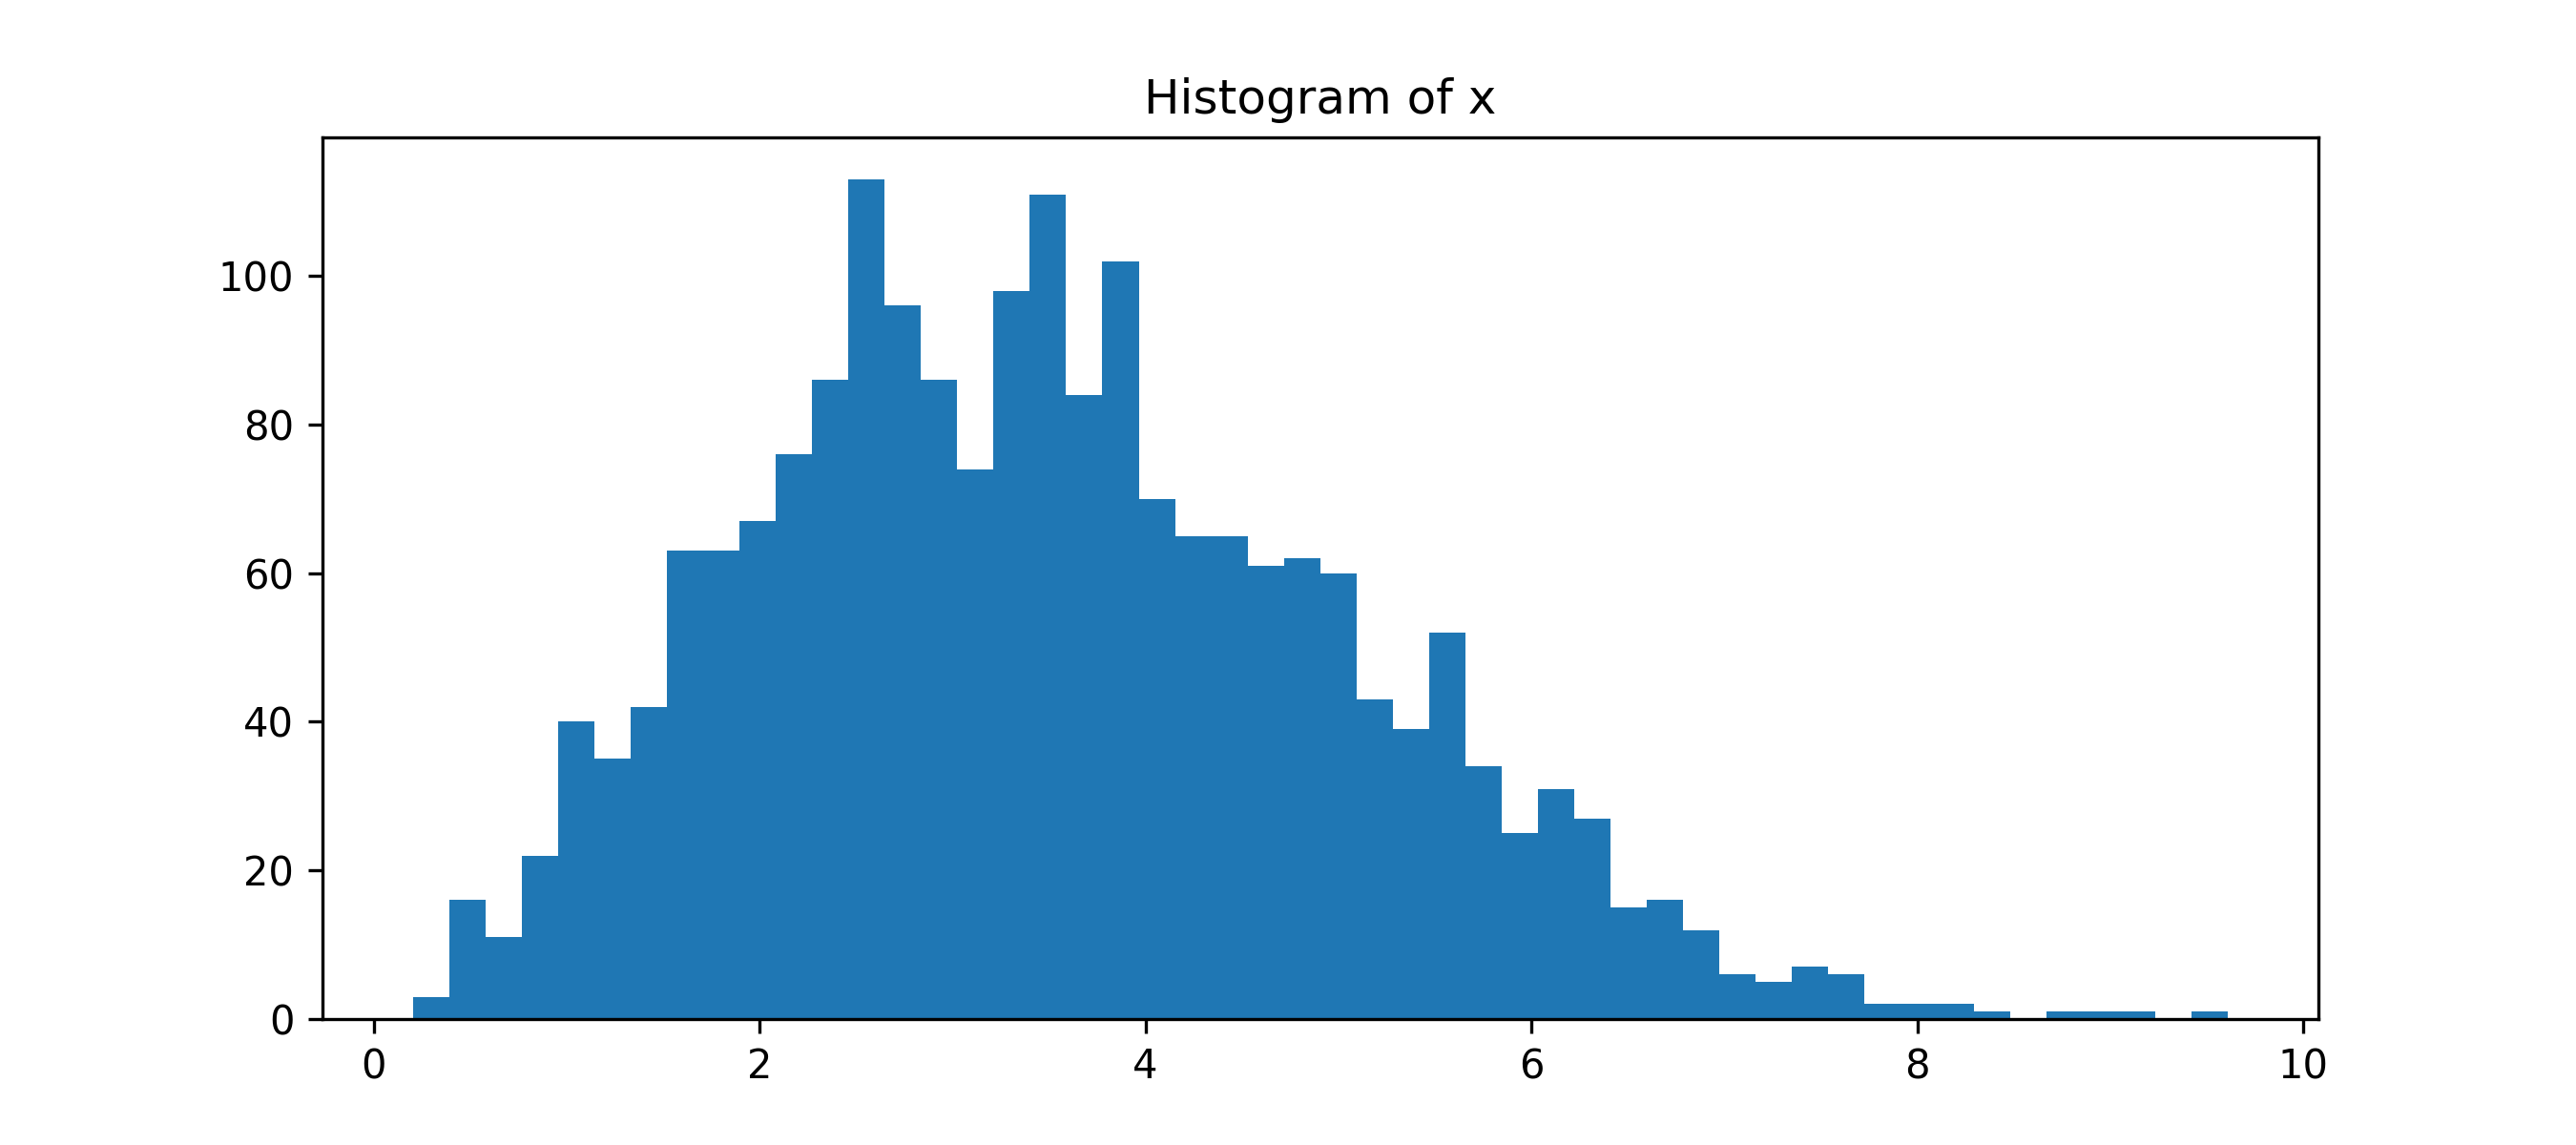
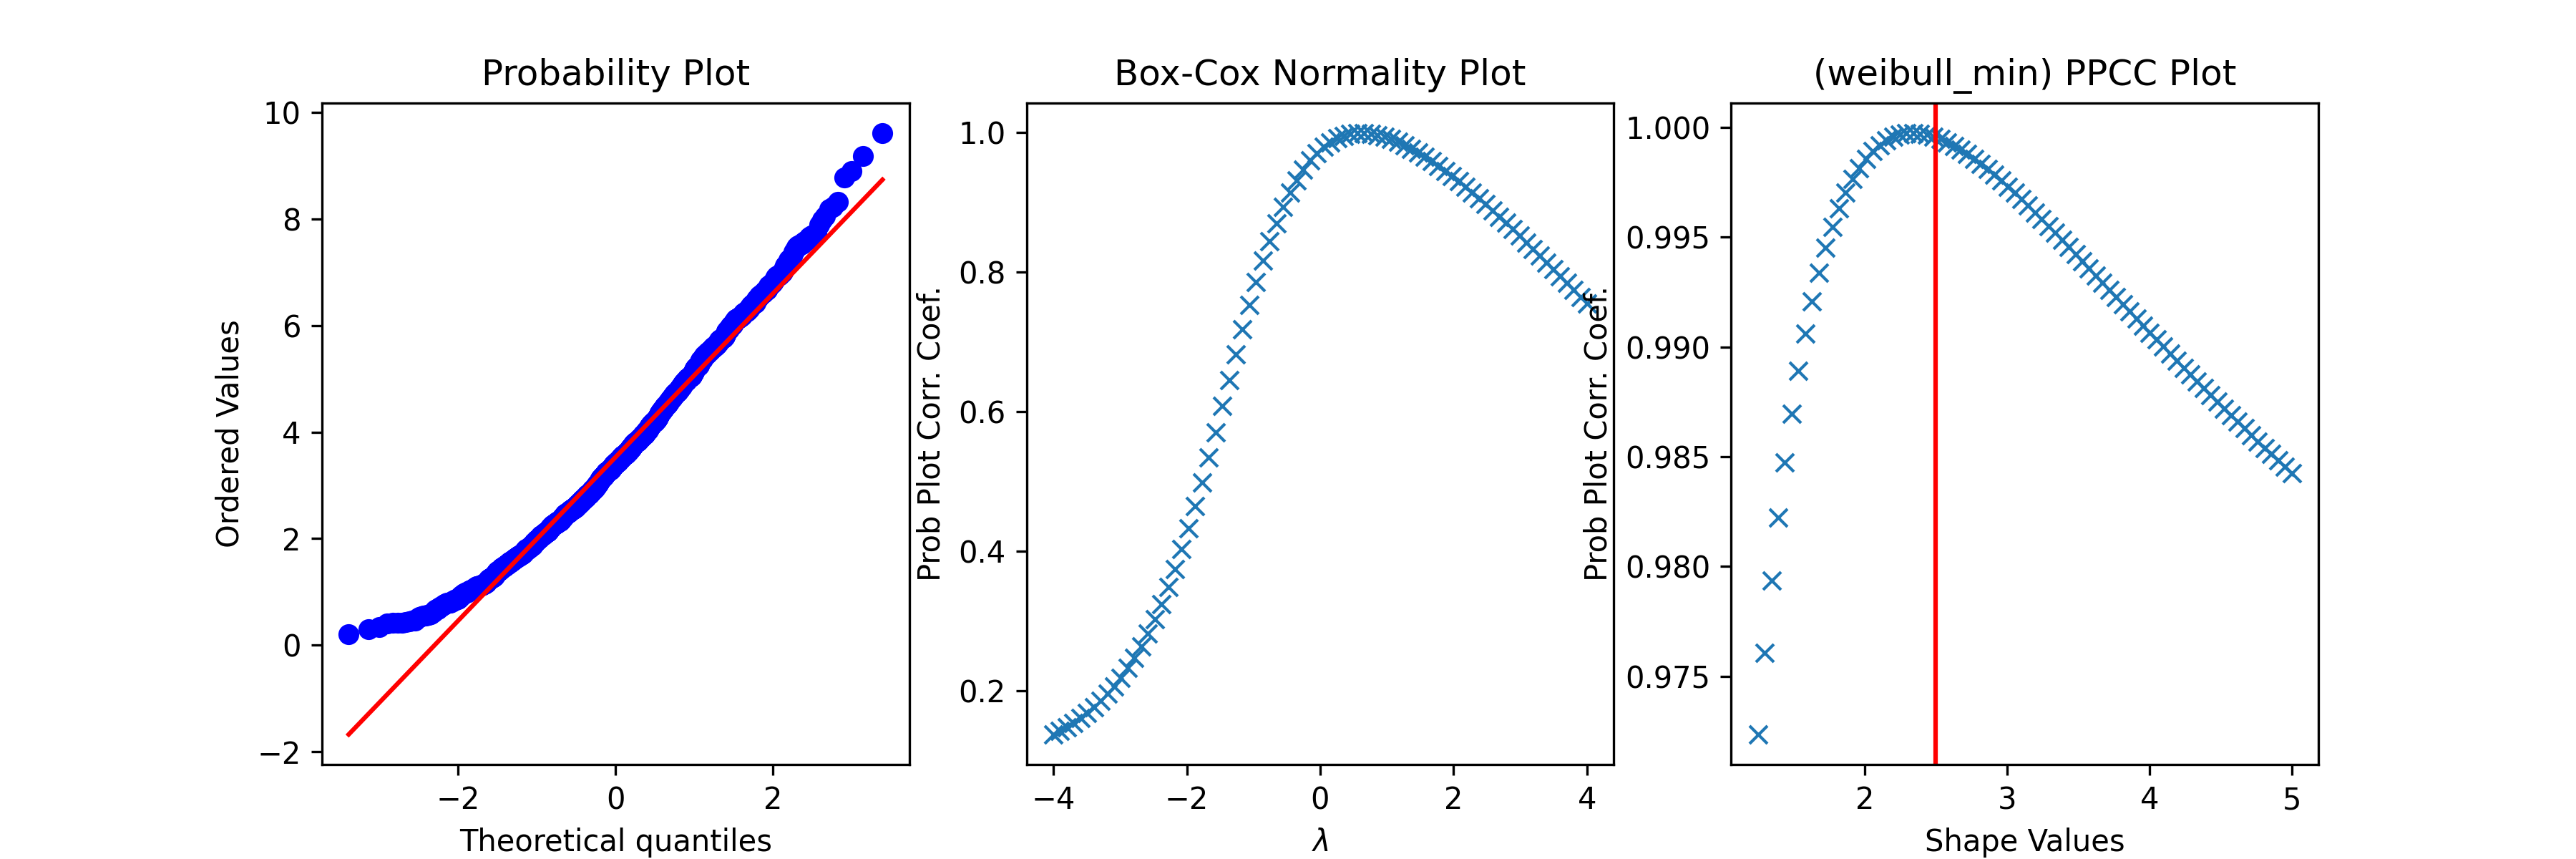
fig2 = plt.figure(figsize=(12, 4))
ax1 = fig2.add_subplot(1, 3, 1)
ax2 = fig2.add_subplot(1, 3, 2)
ax3 = fig2.add_subplot(1, 3, 3)
res = stats.probplot(x, plot=ax1)
res = stats.boxcox_normplot(x, -4, 4, plot=ax2)
res = stats.ppcc_plot(x, c/2, 2*c, dist='weibull_min', plot=ax3)
✓
ax3.axvline(c, color='r')
✗plt.show()
✓
See also
- boxcox_normplot
- ppcc_max
- probplot
- tukeylambda
Aliases
-
scipy.stats.ppcc_plot