bundles / scipy 1.17.1 / scipy / stats / _morestats / ppcc_max
function
scipy.stats._morestats:ppcc_max
source: /scipy/stats/_morestats.py :683
Signature
def ppcc_max ( x , brack = (0.0, 1.0) , dist = tukeylambda ) Summary
Calculate the shape parameter that maximizes the PPCC.
Extended Summary
The probability plot correlation coefficient (PPCC) plot can be used to determine the optimal shape parameter for a one-parameter family of distributions. ppcc_max returns the shape parameter that would maximize the probability plot correlation coefficient for the given data to a one-parameter family of distributions.
Parameters
x: array_likeInput array.
brack: tuple, optionalTriple (a,b,c) where (a<b<c). If bracket consists of two numbers (a, c) then they are assumed to be a starting interval for a downhill bracket search (see scipy.optimize.brent).
dist: str or stats.distributions instance, optionalDistribution or distribution function name. Objects that look enough like a stats.distributions instance (i.e. they have a
ppfmethod) are also accepted. The default is'tukeylambda'.
Returns
shape_value: floatThe shape parameter at which the probability plot correlation coefficient reaches its max value.
Notes
The brack keyword serves as a starting point which is useful in corner cases. One can use a plot to obtain a rough visual estimate of the location for the maximum to start the search near it.
Array API Standard Support
ppcc_max has experimental support for Python Array API Standard compatible backends in addition to NumPy. Please consider testing these features by setting an environment variable SCIPY_ARRAY_API=1 and providing CuPy, PyTorch, JAX, or Dask arrays as array arguments. The following combinations of backend and device (or other capability) are supported.
====================  ====================  ====================
Library               CPU                   GPU
====================  ====================  ====================
NumPy                 ✅                     n/a
CuPy                  n/a                   ⛔
PyTorch               ⛔                     ⛔
JAX                   ⛔                     ⛔
Dask                  ⛔                     n/a
====================  ====================  ====================
See
dev-arrayapifor more information.
Examples
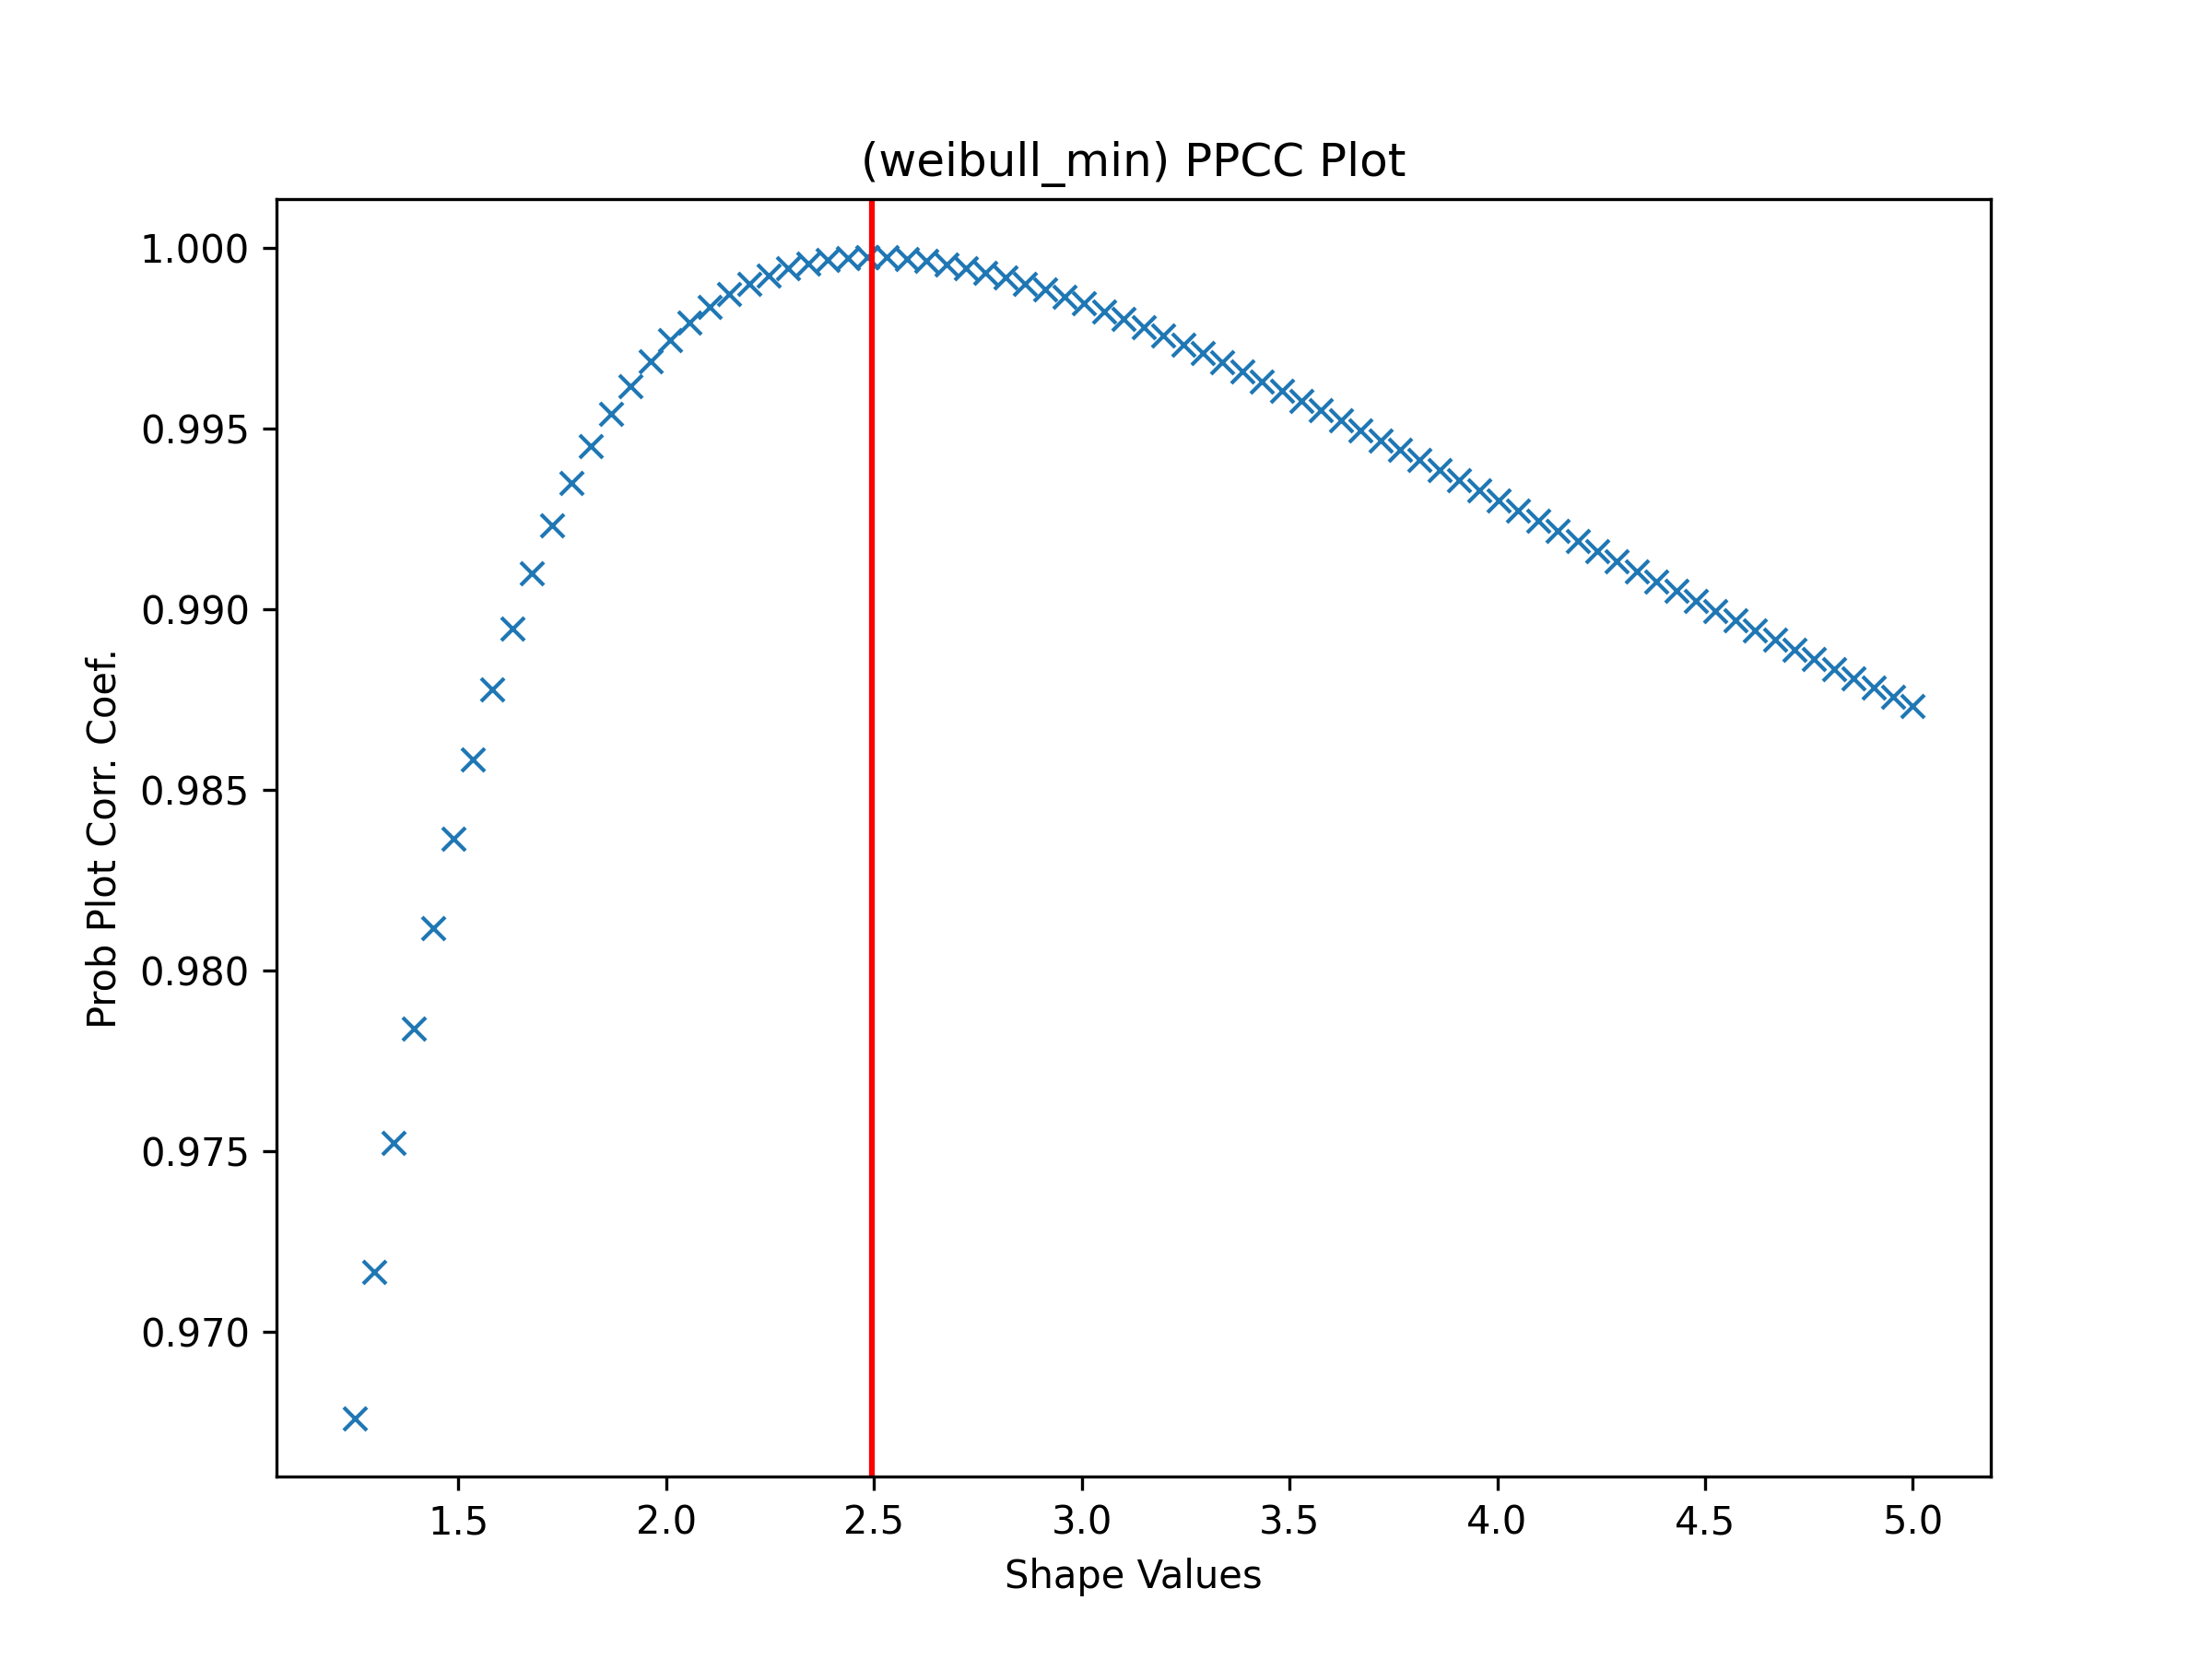
First we generate some random data from a Weibull distribution with shape parameter 2.5:import numpy as np from scipy import stats import matplotlib.pyplot as plt rng = np.random.default_rng() c = 2.5 x = stats.weibull_min.rvs(c, scale=4, size=2000, random_state=rng)✓
fig, ax = plt.subplots(figsize=(8, 6))
res = stats.ppcc_plot(x, c/2, 2*c, dist='weibull_min', plot=ax)
✓
cmax = stats.ppcc_max(x, brack=(c/2, 2*c), dist='weibull_min')
✓ax.axvline(cmax, color='r')
✗plt.show()
✓
See also
Aliases
-
scipy.stats.ppcc_max