bundles / scipy 2.0.0.dev0+git20260907.41eeb59 / scipy / signal / _ltisys / lti / bode
function
scipy.signal._ltisys:lti.bode
source: build-install/usr/lib/python3.14/site-packages/scipy/signal/_ltisys.py:320
Signature
def bode(self, w = None, n = 100)Summary
Calculate Bode magnitude and phase data of a continuous-time system.
Parameters
w: array_like, optionalArray of frequencies (in rad/s). Magnitude and phase data is calculated for every value in this array. If not given a reasonable set will be calculated.
n: int, optionalNumber of frequency points to compute if
wis not given. Thenfrequencies are logarithmically spaced in an interval chosen to include the influence of the poles and zeros of the system. Defaults to 100.
Returns
w: 1D ndarrayFrequency array [rad/s]
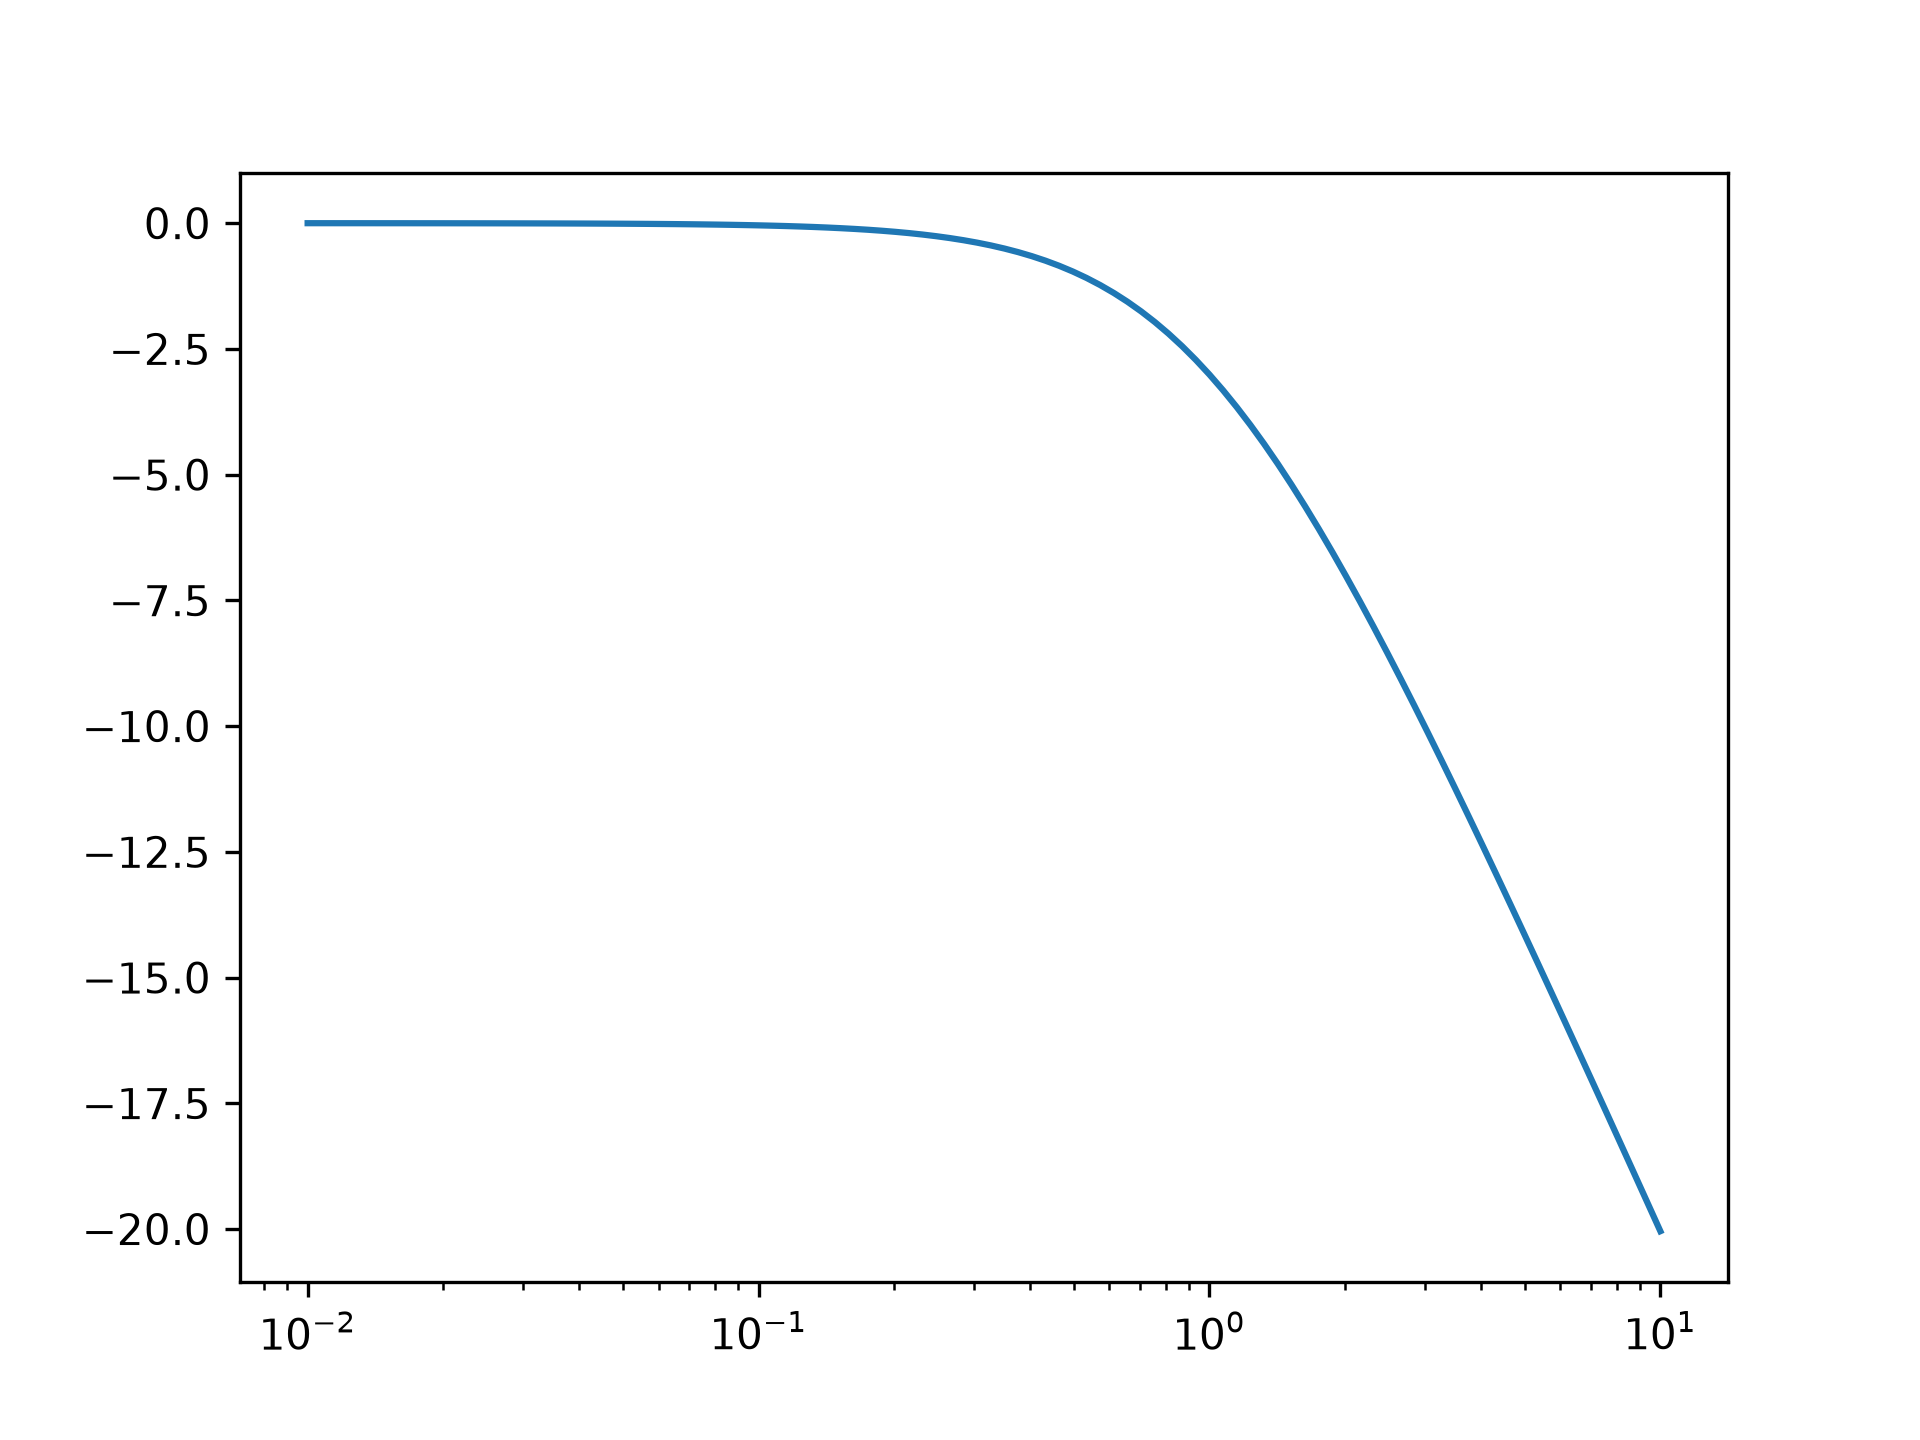
mag: 1D ndarrayMagnitude array [dB]
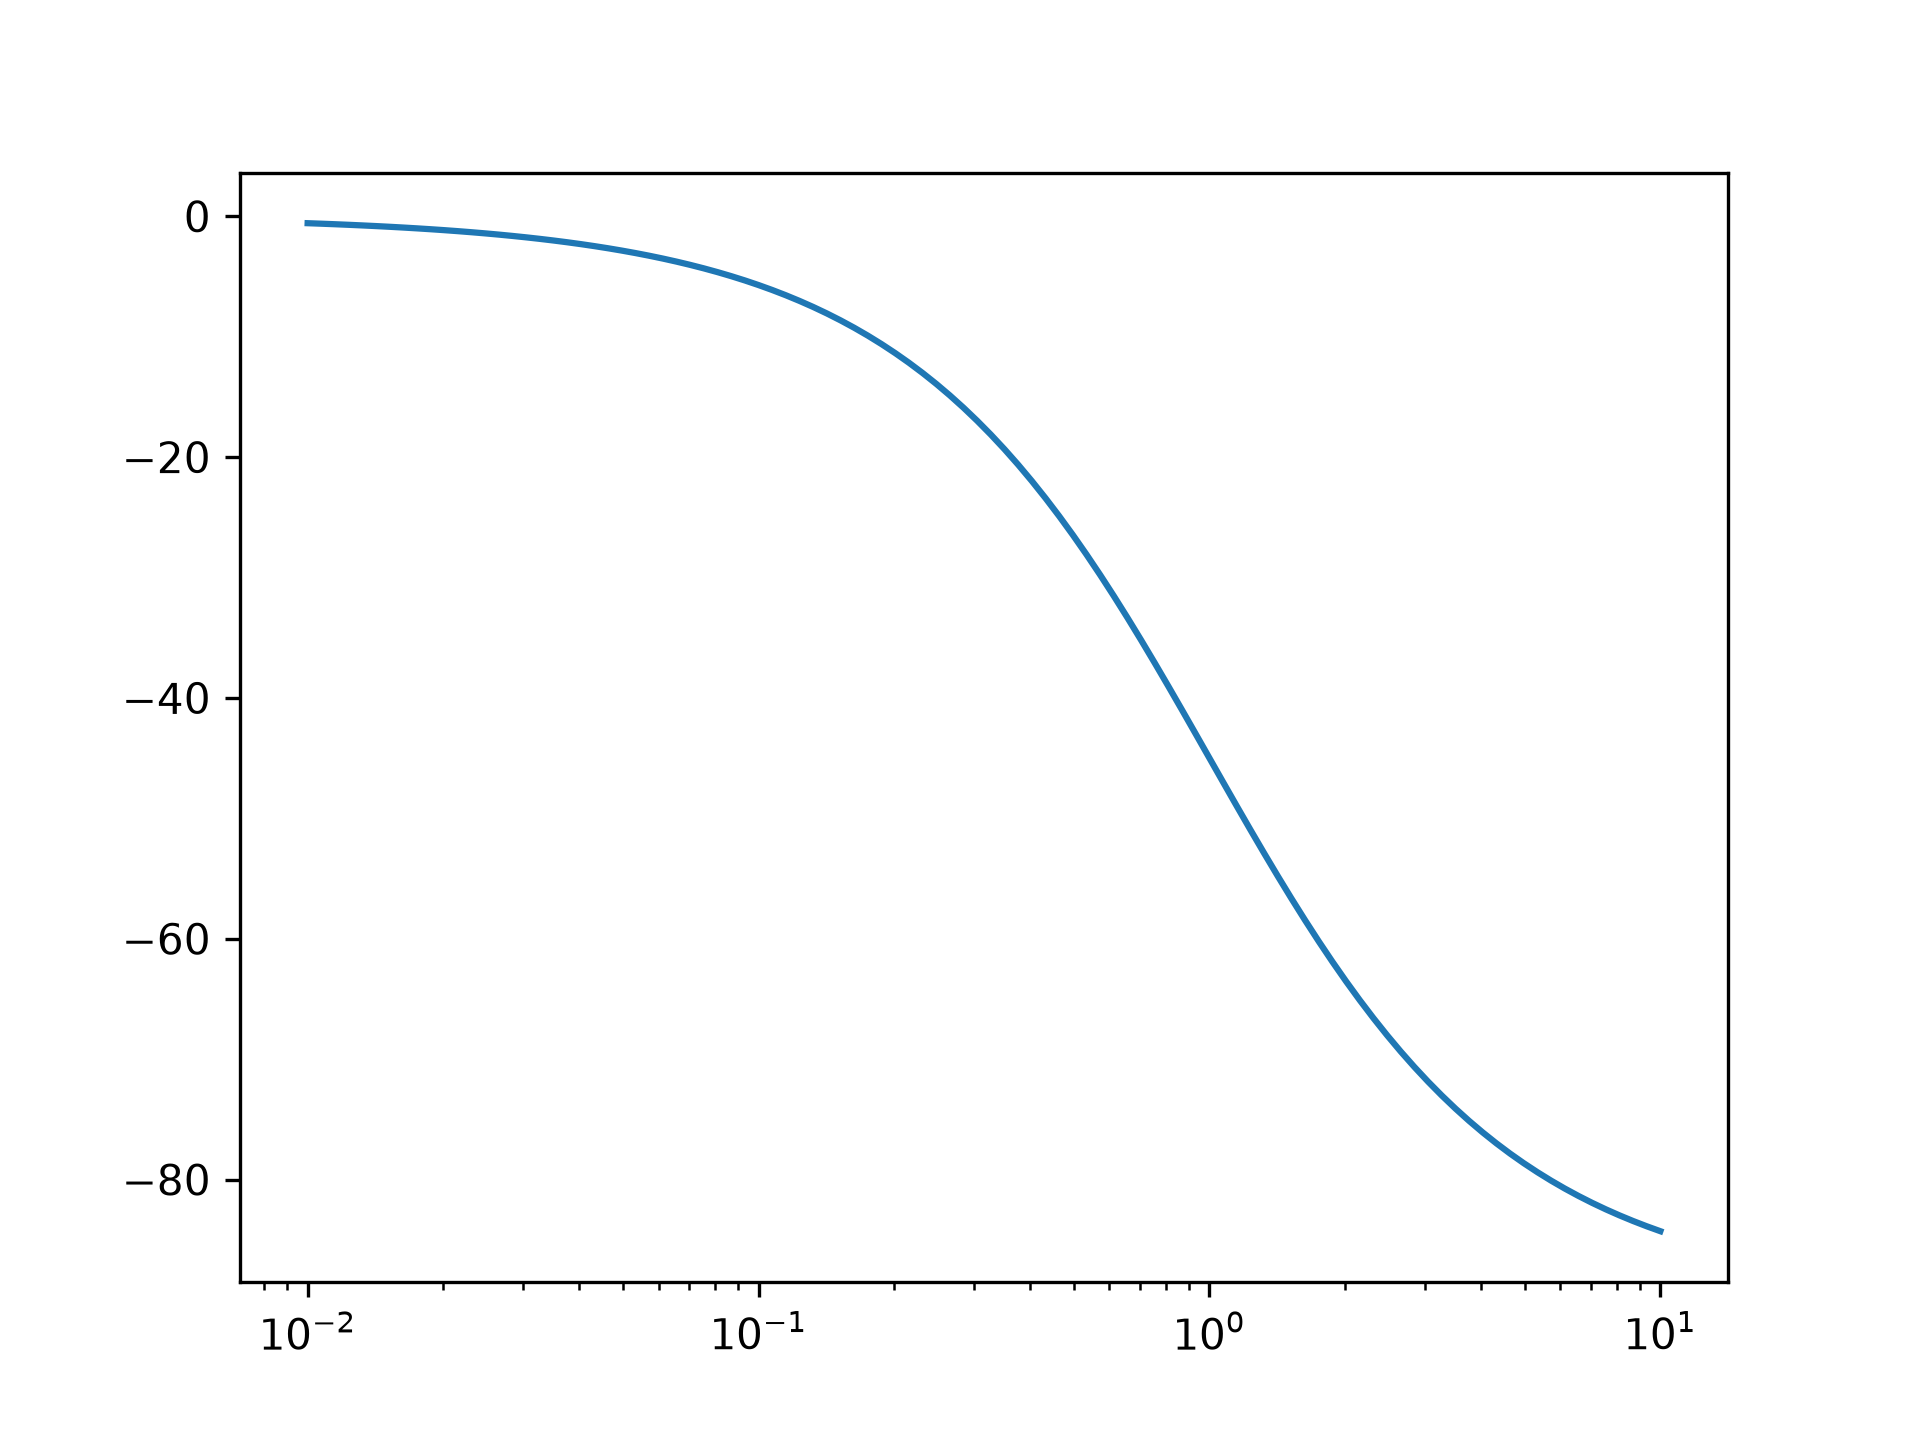
phase: 1D ndarrayPhase array [deg]
Examples
from scipy import signal
import matplotlib.pyplot as plt
✓
sys = signal.TransferFunction([1], [1, 1])
w, mag, phase = sys.bode()
✓
plt.figure()
plt.semilogx(w, mag)    # Bode magnitude plot
plt.figure()
plt.semilogx(w, phase)  # Bode phase plot
✗
[<matplotlib.lines.Line2D object at 0x7f3f4382bcb0>]
plt.show()
✓
See also
- bode
Bode plot data for continuous-time LTI systems.
Aliases
scipy.signal.lti.bode