bundles / scipy 2.0.0.dev0+git20260907.41eeb59 / scipy / signal / windows / _windows / general_cosine
function
scipy.signal.windows._windows:general_cosine
source: build-install/usr/lib/python3.14/site-packages/scipy/signal/windows/_windows.py:68
Signature
def general_cosine(M, a, sym = True)Summary
Generic weighted sum of cosine terms window.
Parameters
M: intNumber of points in the output window
a: array_likeSequence of weighting coefficients. This uses the convention of being centered on the origin, so these will typically all be positive numbers, not alternating sign.
sym: bool, optionalWhen True (default), generates a symmetric window, for use in filter design. When False, generates a periodic window, for use in spectral analysis.
Returns
w: ndarrayThe array of window values.
Examples
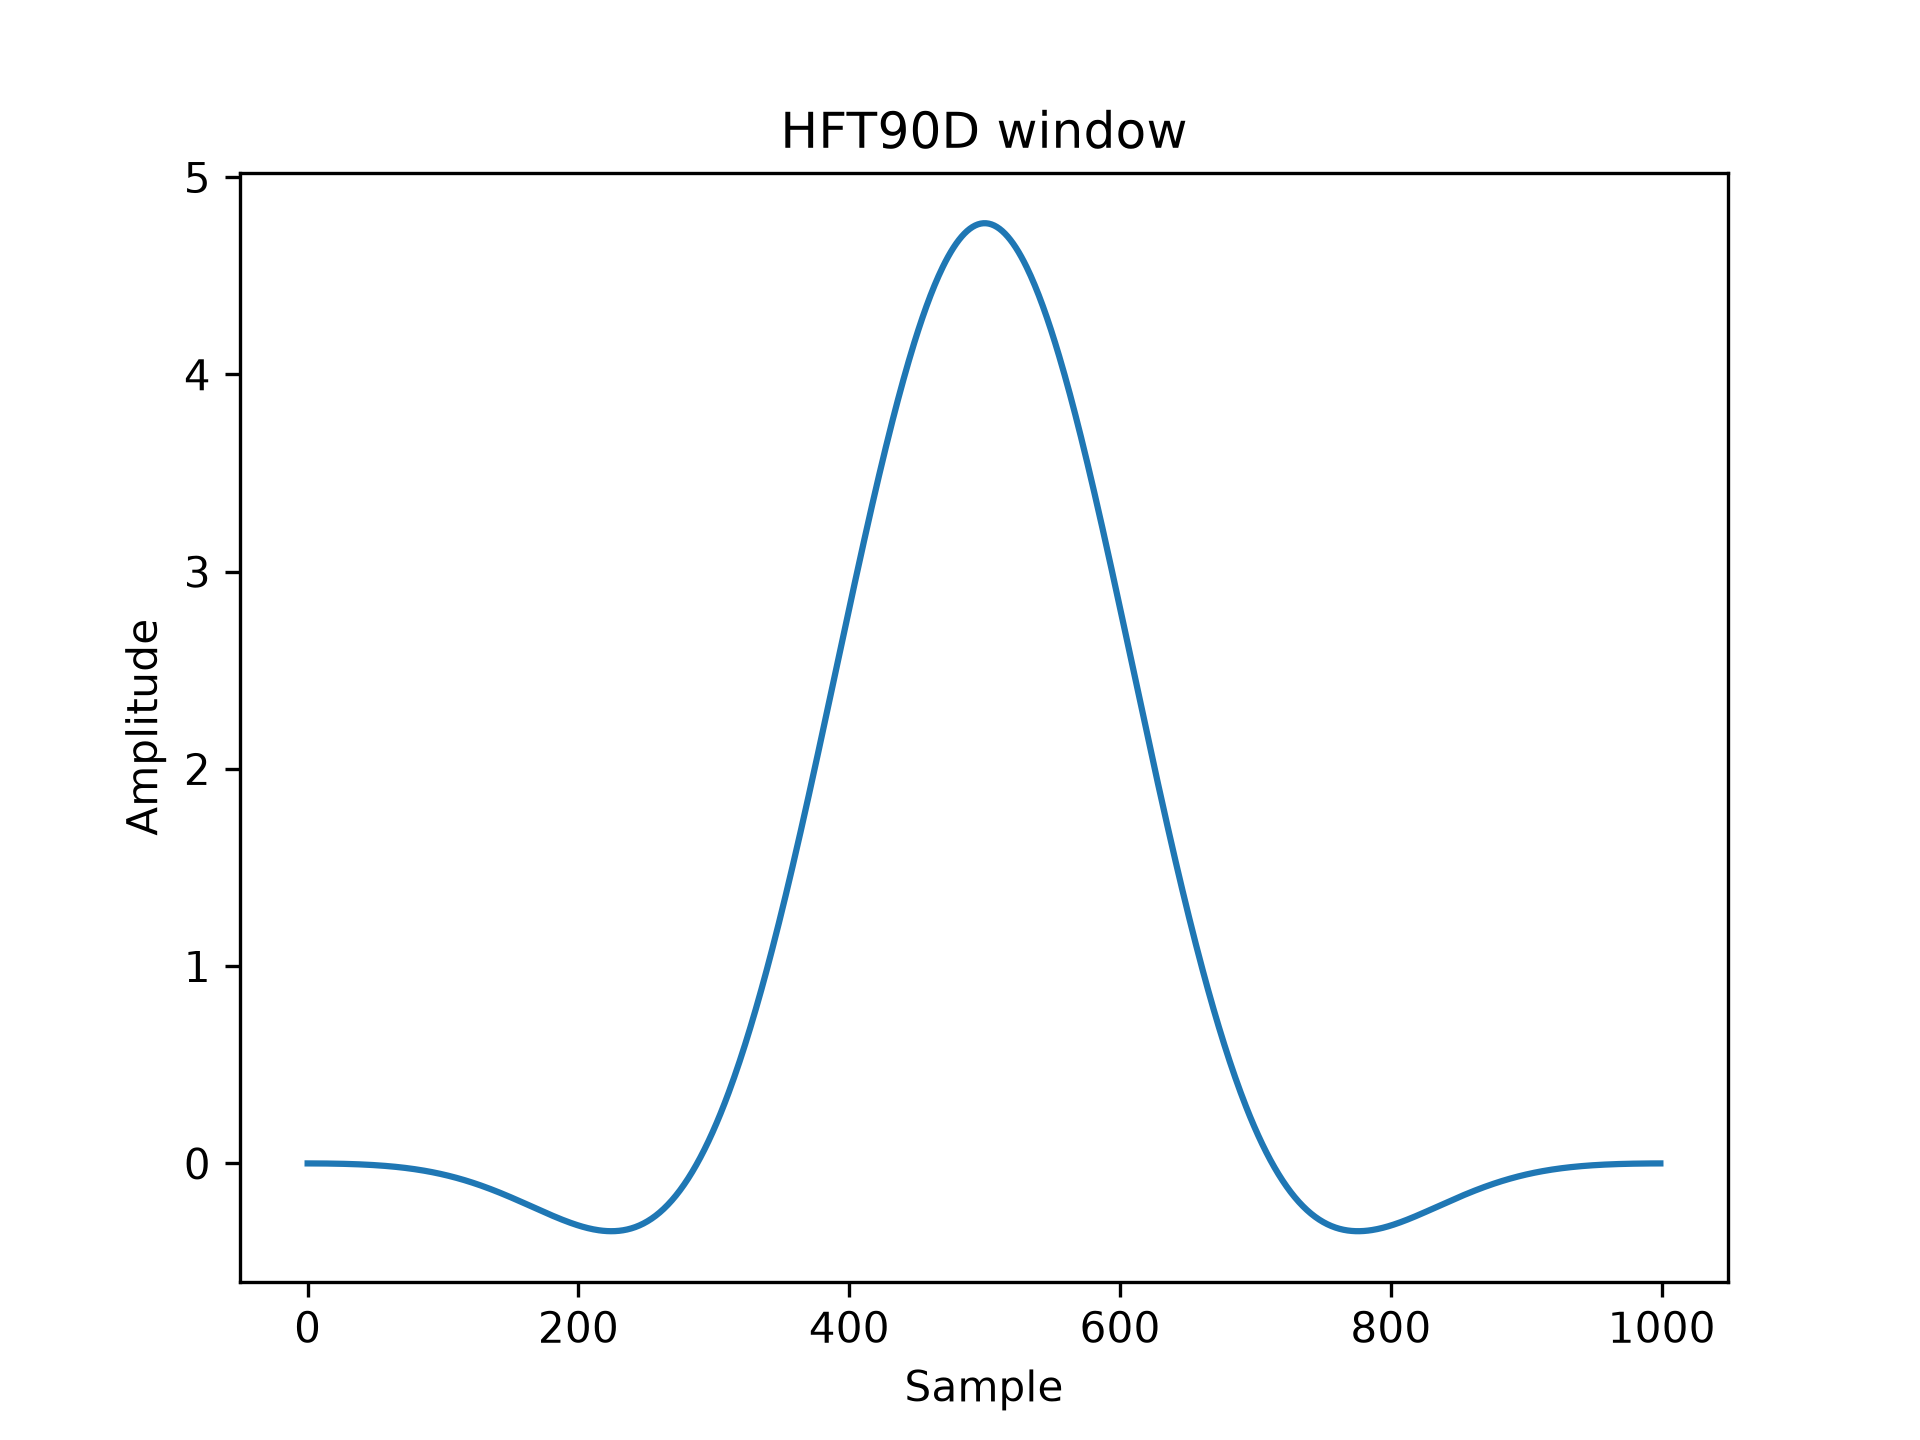
Heinzel describes a flat-top window named "HFT90D" with formula: [2]_ .. math:: w_j = 1 - 1.942604 \cos(z) + 1.340318 \cos(2z) - 0.440811 \cos(3z) + 0.043097 \cos(4z) where .. math:: z = \frac{2 \pi j}{N}, j = 0...N - 1 Since this uses the convention of starting at the origin, to reproduce the window, we need to convert every other coefficient to a positive number:HFT90D = [1, 1.942604, 1.340318, 0.440811, 0.043097]
✓import numpy as np from scipy.signal.windows import general_cosine from scipy.fft import fft, fftshift import matplotlib.pyplot as plt✓
window = general_cosine(1000, HFT90D, sym=False)
✓plt.plot(window) plt.title("HFT90D window") plt.ylabel("Amplitude") plt.xlabel("Sample")✗
Text(0.5, 0, 'Sample')
plt.figure()
✗<Figure size 640x480 with 0 Axes>
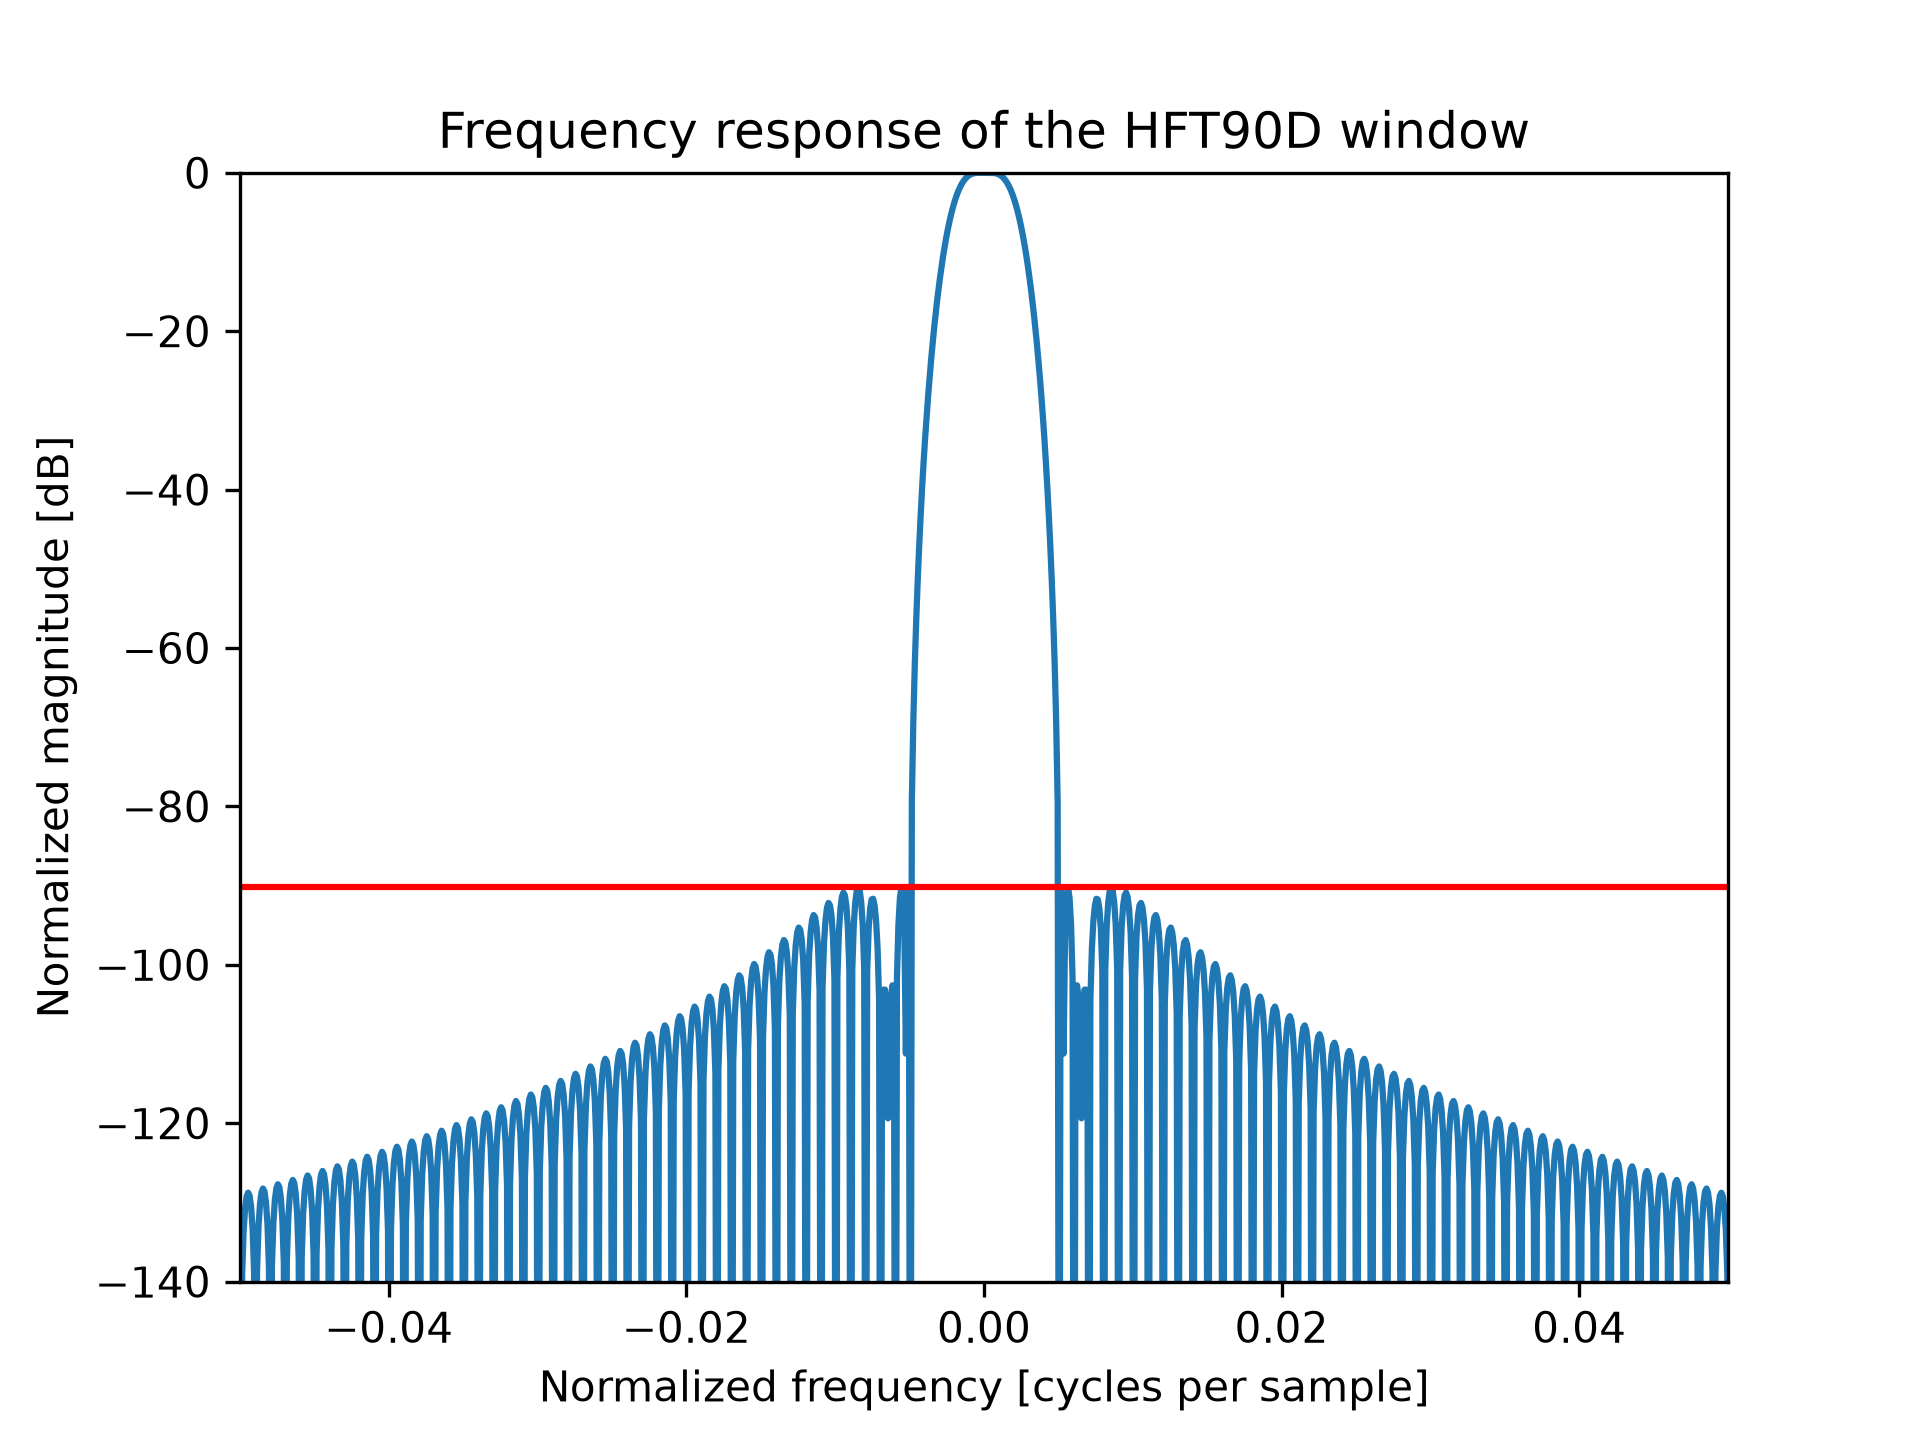
A = fft(window, 10000) / (len(window)/2.0)
freq = np.linspace(-0.5, 0.5, len(A))
response = np.abs(fftshift(A / abs(A).max()))
response = 20 * np.log10(np.maximum(response, 1e-10))
✓
plt.plot(freq, response)
plt.axis([-50/1000, 50/1000, -140, 0])
plt.title("Frequency response of the HFT90D window")
plt.ylabel("Normalized magnitude [dB]")
plt.xlabel("Normalized frequency [cycles per sample]")
plt.axhline(-90.2, color='red')
✗
<matplotlib.lines.Line2D object at 0x7f3f437234d0>
plt.show()
✓
Aliases
scipy.signal.windows.general_cosine