bundles / scipy 2.0.0.dev0+git20260907.41eeb59 / scipy / signal / windows / _windows / lanczos
function
scipy.signal.windows._windows:lanczos
source: build-install/usr/lib/python3.14/site-packages/scipy/signal/windows/_windows.py:2411
Signature
def lanczos(M, *, sym = True, xp = None, device = None)Summary
Return a Lanczos window also known as a sinc window.
Parameters
M: intNumber of points in the output window. If zero, an empty array is returned. An exception is thrown when it is negative.
sym: bool, optionalWhen True (default), generates a symmetric window, for use in filter design. When False, generates a periodic window, for use in spectral analysis.
xp: array_namespace, optionalOptional array namespace. Should be compatible with the array API standard, or supported by array-api-compat. Default:
numpydevice: anyoptional device specification for output. Should match one of the supported device specification in
xp.
Returns
w: ndarrayThe window, with the maximum value normalized to 1 (though the value 1 does not appear if
Mis even andsymis True).
Notes
The Lanczos window is defined as
where
The Lanczos window has reduced Gibbs oscillations and is widely used for filtering climate timeseries with good properties in the physical and spectral domains.
Examples
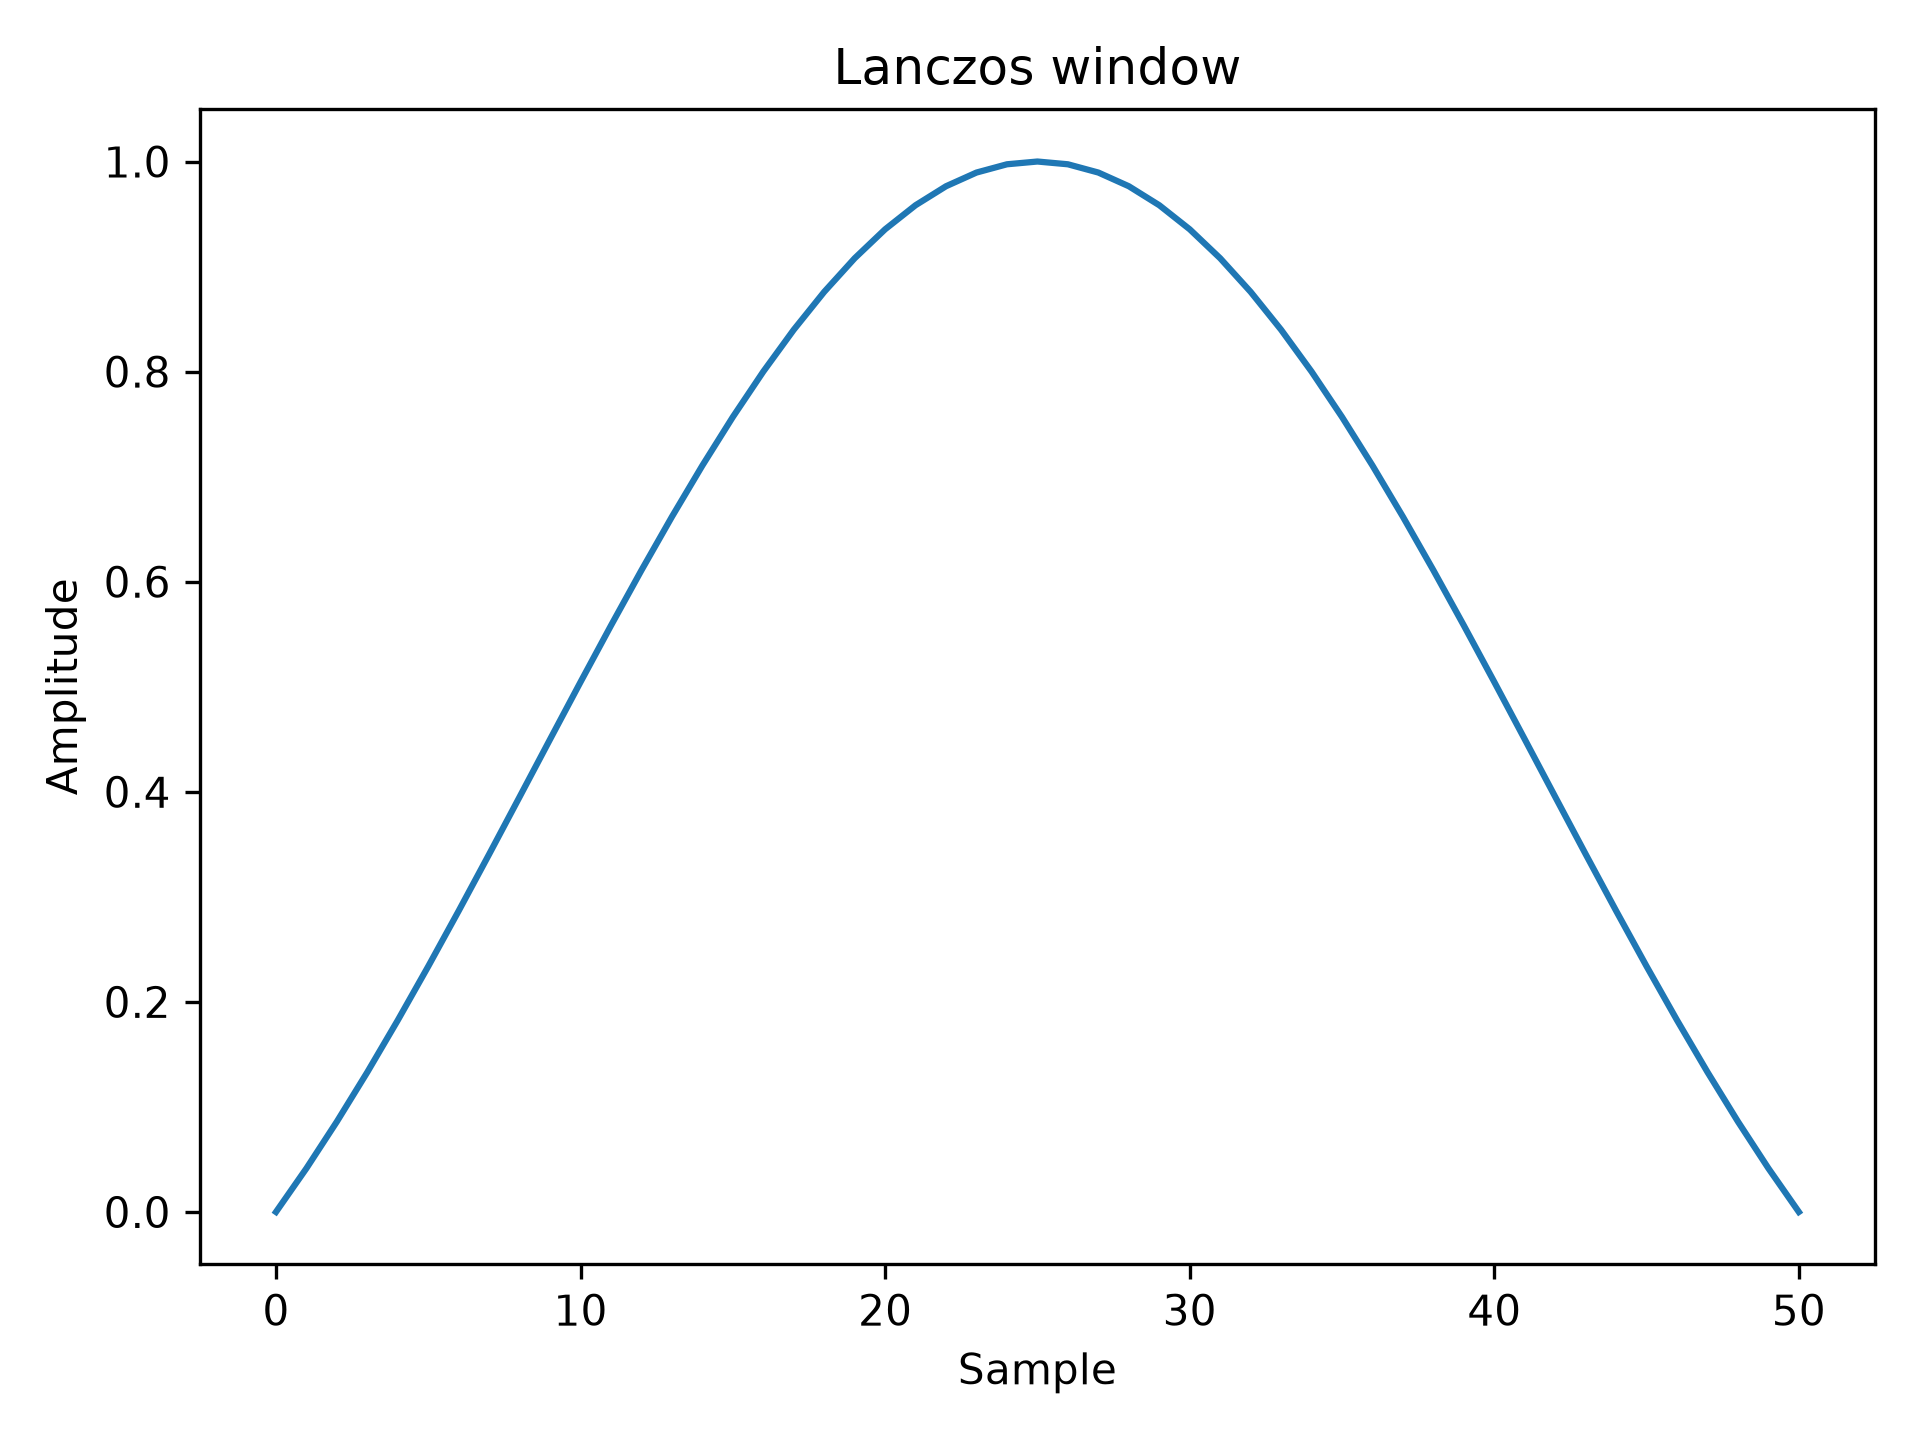
Plot the windowimport numpy as np from scipy.signal.windows import lanczos from scipy.fft import fft, fftshift import matplotlib.pyplot as plt fig, ax = plt.subplots(1) window = lanczos(51)✓
ax.plot(window)
ax.set_title("Lanczos window")
ax.set_ylabel("Amplitude")
ax.set_xlabel("Sample")
✗
Text(0.5, 0, 'Sample')
fig.tight_layout()
plt.show()
✓
fig, ax = plt.subplots(1)
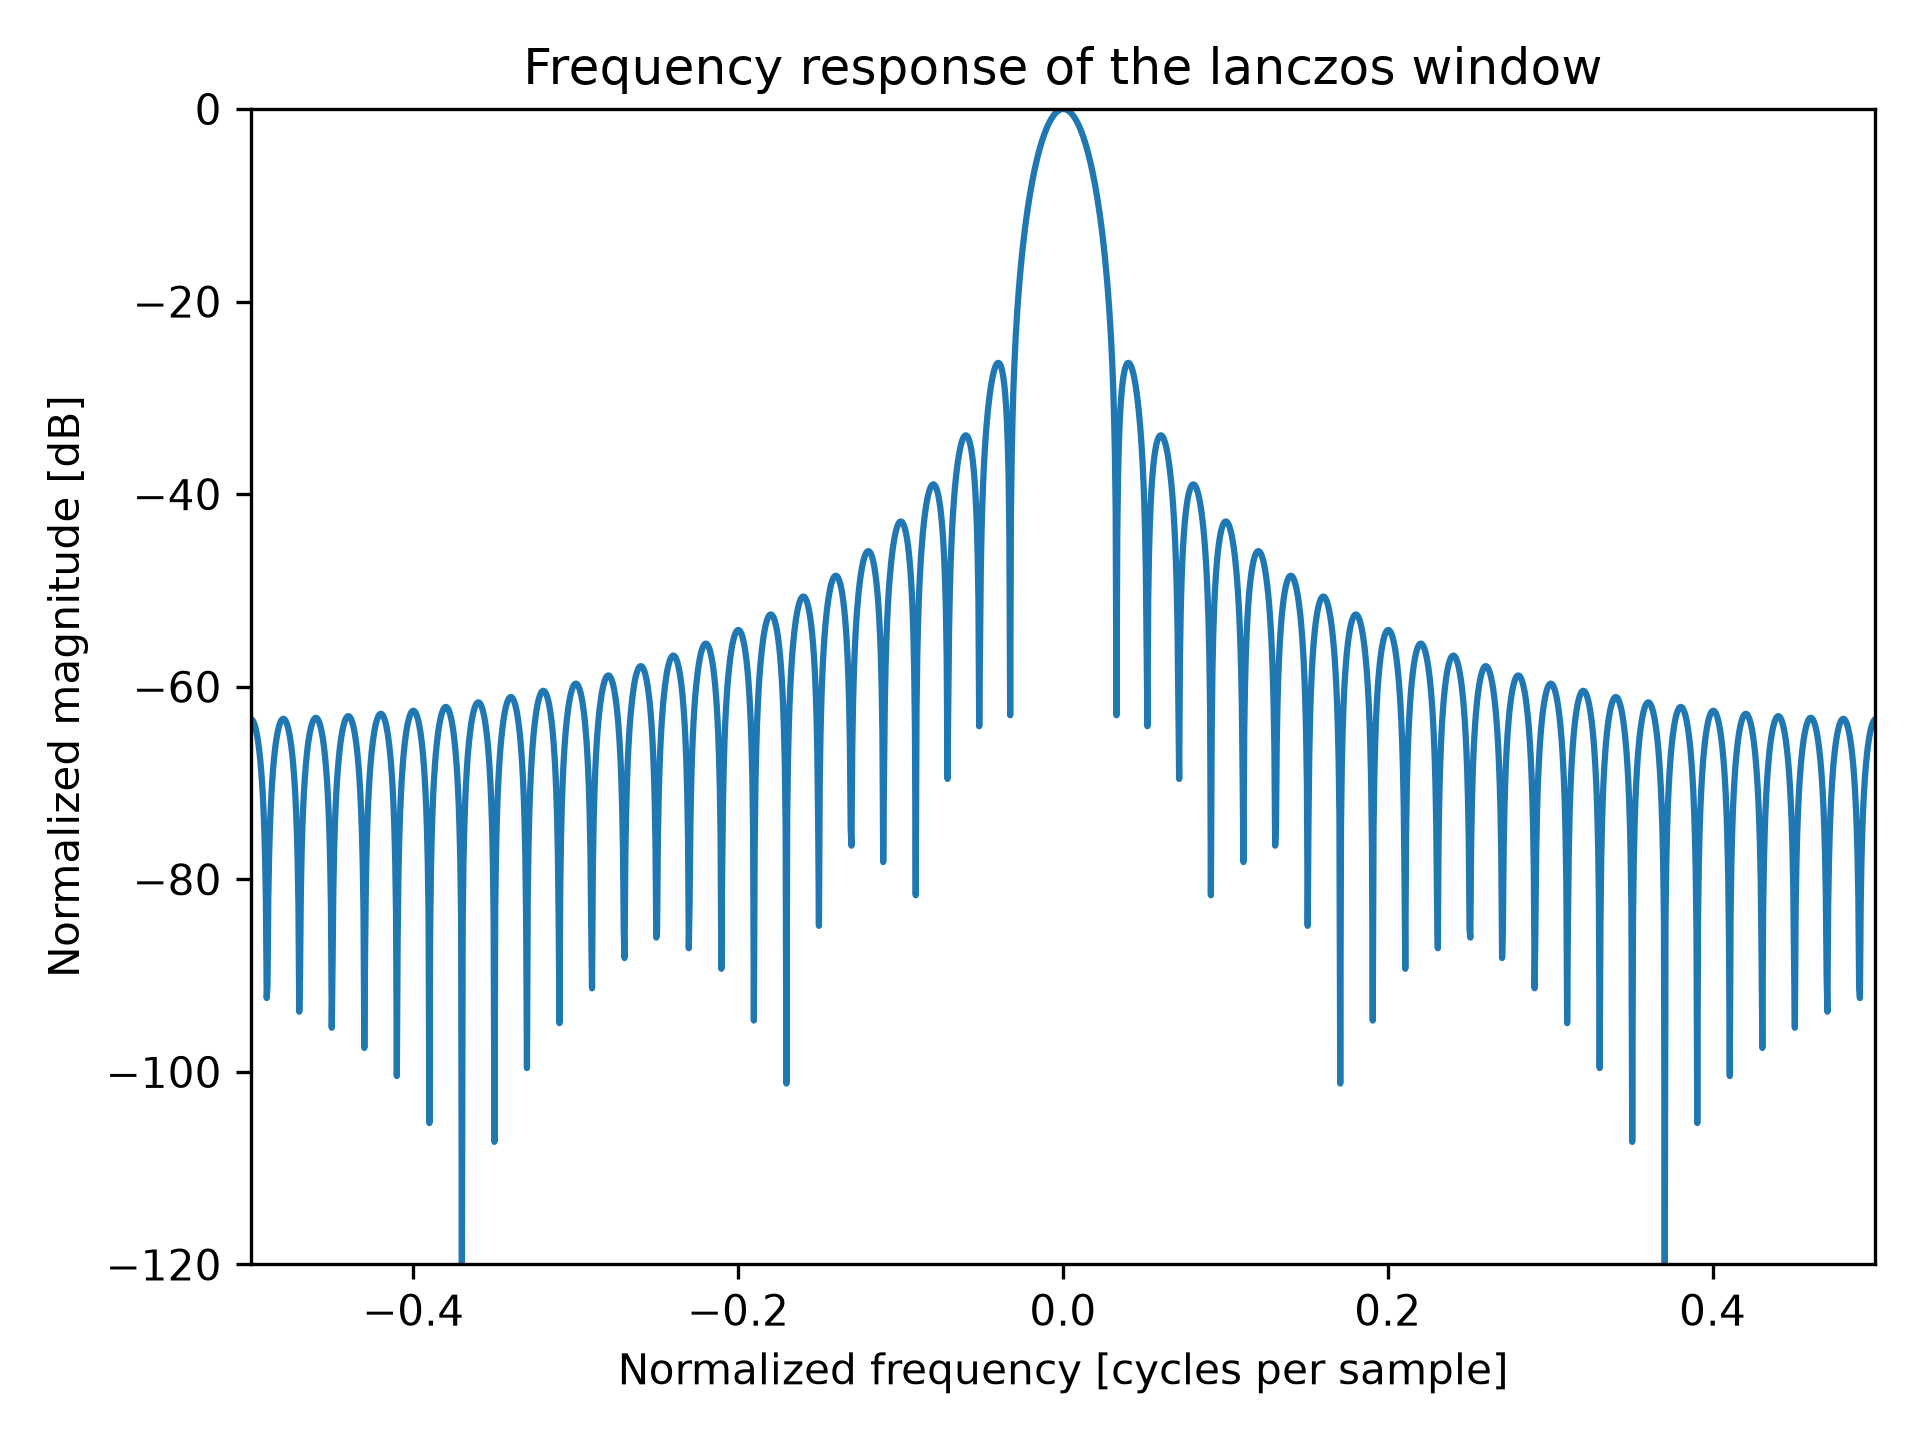
A = fft(window, 2048) / (len(window)/2.0)
freq = np.linspace(-0.5, 0.5, len(A))
response = 20 * np.log10(np.abs(fftshift(A / abs(A).max())))
✓
ax.plot(freq, response)
ax.set_xlim(-0.5, 0.5)
ax.set_ylim(-120, 0)
ax.set_title("Frequency response of the lanczos window")
ax.set_ylabel("Normalized magnitude [dB]")
ax.set_xlabel("Normalized frequency [cycles per sample]")
✗
Text(0.5, 0, 'Normalized frequency [cycles per sample]')
fig.tight_layout()
plt.show()
✓
Aliases
scipy.signal.windows.lanczos