bundles / scipy latest / scipy / stats / _distribution_infrastructure / Mixture
ABCMeta
scipy.stats._distribution_infrastructure:Mixture
Signature
def Mixture ( components , * , weights = None ) Members
-
__init__ -
__repr__ -
__str__ -
_full -
_input_validation -
_invert -
_logsum -
_moment_central -
_moment_raw -
_moment_standardized -
_raise_if_method -
_sum -
ccdf -
cdf -
entropy -
iccdf -
icdf -
ilogccdf -
ilogcdf -
kurtosis -
logccdf -
logcdf -
logentropy -
logpdf -
logpmf -
mean -
median -
mode -
moment -
pdf -
pmf -
sample -
skewness -
standard_deviation -
support -
variance
Summary
Representation of a mixture distribution.
Extended Summary
A mixture distribution is the distribution of a random variable defined in the following way: first, a random variable is selected from components according to the probabilities given by weights, then the selected random variable is realized.
Parameters
components: sequence of `ContinuousDistribution`The underlying instances of ContinuousDistribution. All must have scalar shape parameters (if any); e.g., the pdf evaluated at a scalar argument must return a scalar.
weights: sequence of floats, optionalThe corresponding probabilities of selecting each random variable. Must be non-negative and sum to one. The default behavior is to weight all components equally.
Attributes
components: sequence of `ContinuousDistribution`The underlying instances of ContinuousDistribution.
weights: ndarrayThe corresponding probabilities of selecting each random variable.
Methods
supportsamplemomentmeanmedianmodevariancestandard_deviationskewnesskurtosispdflogpdfcdficdfccdficcdflogcdfilogcdflogccdfilogccdfentropy
Notes
The following abbreviations are used throughout the documentation.
PDF: probability density function
CDF: cumulative distribution function
CCDF: complementary CDF
entropy: differential entropy
log-F: logarithm of F (e.g. log-CDF)
inverse F: inverse function of F (e.g. inverse CDF)
Examples
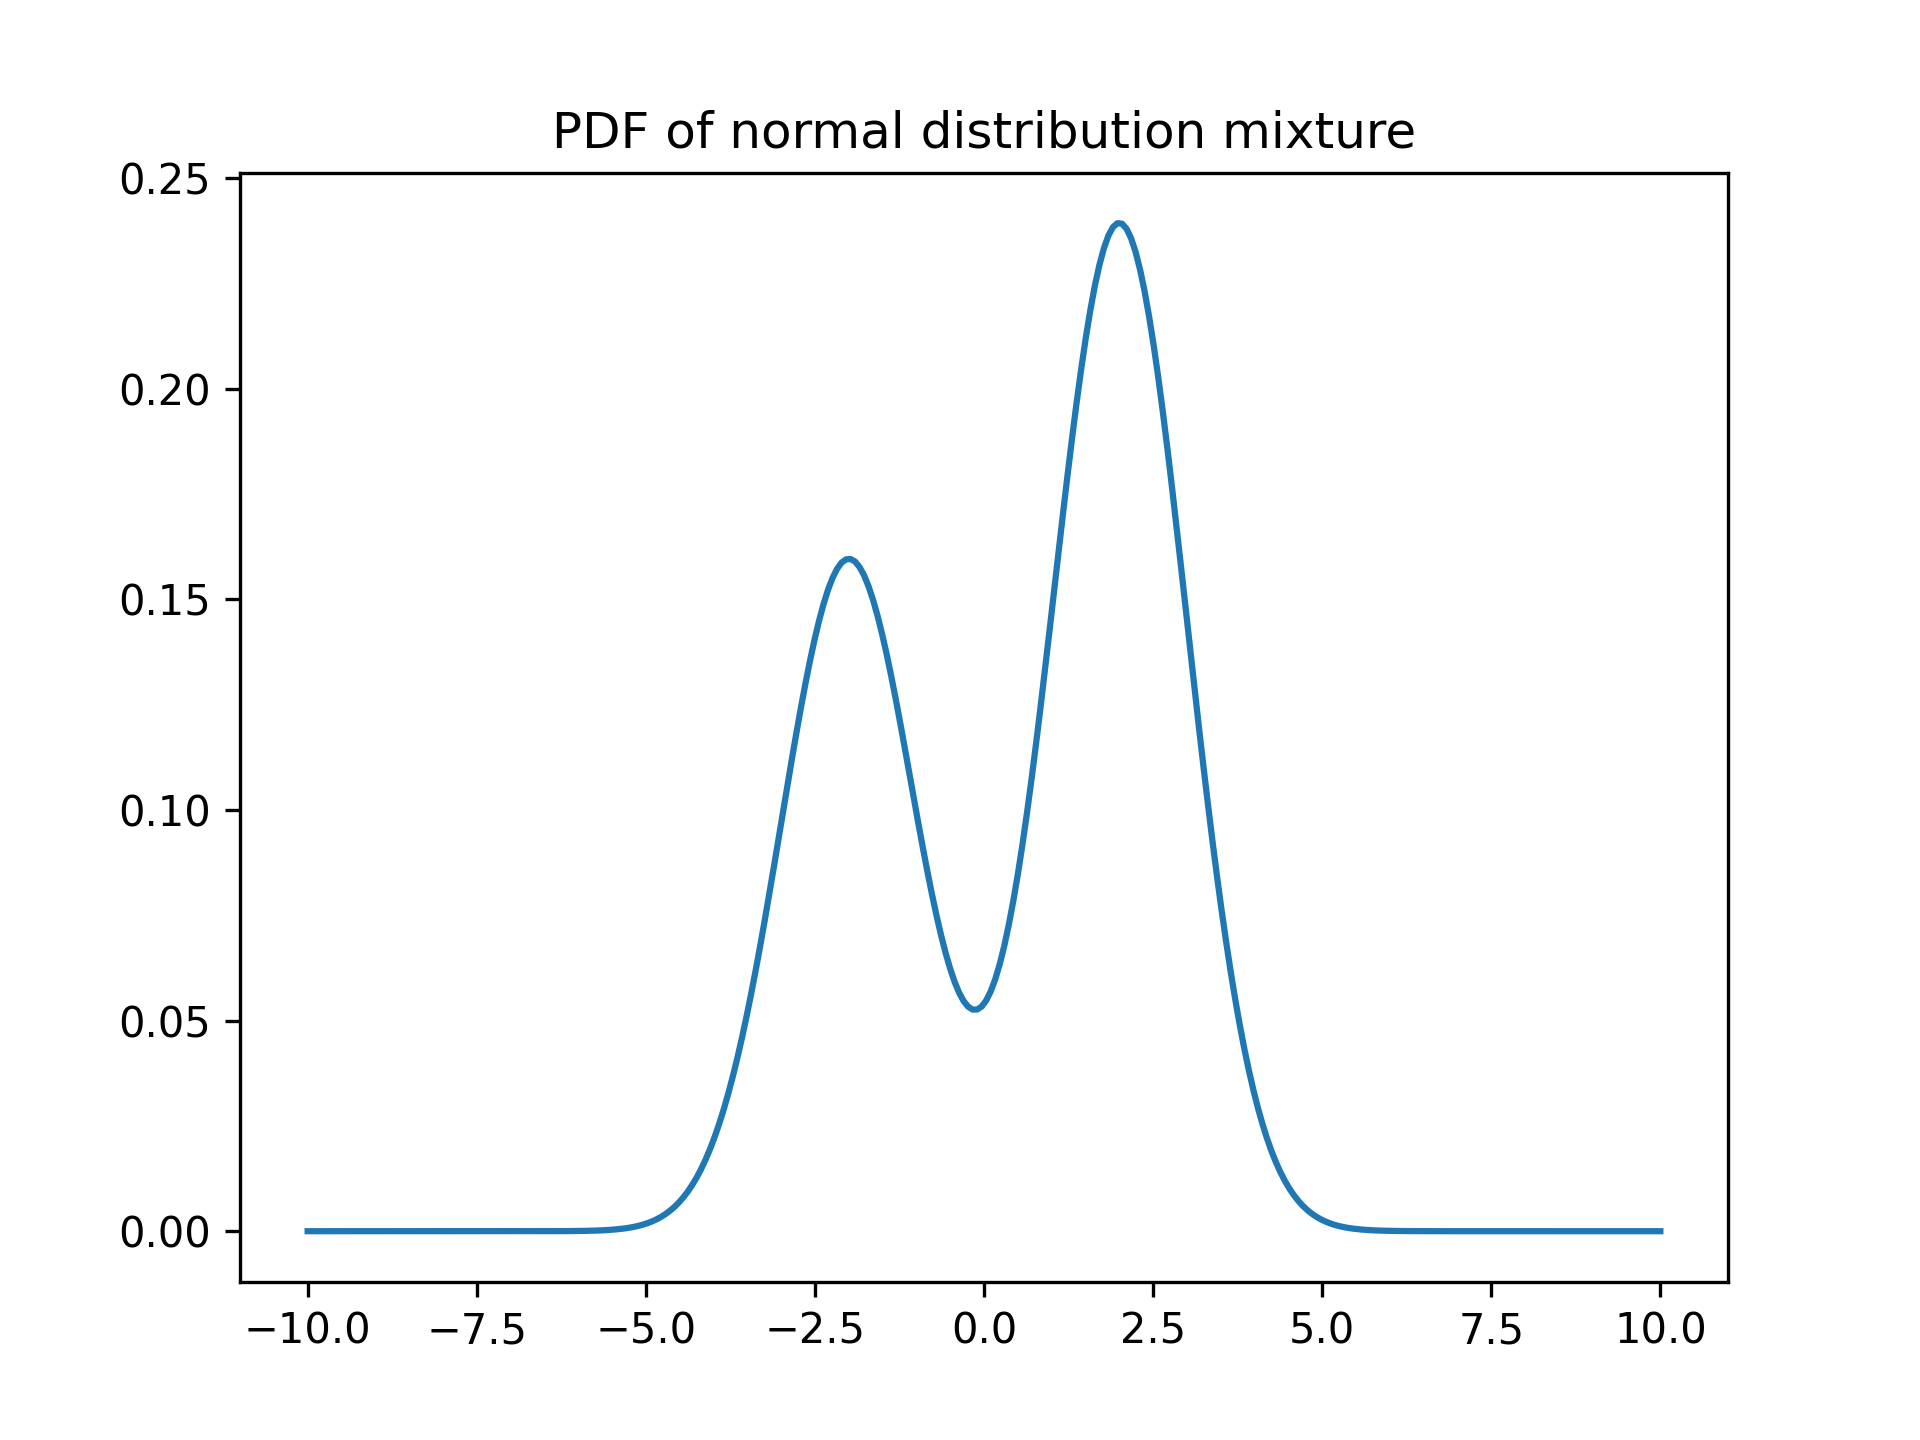
A mixture of normal distributions:import numpy as np from scipy import stats import matplotlib.pyplot as plt X1 = stats.Normal(mu=-2, sigma=1) X2 = stats.Normal(mu=2, sigma=1) mixture = stats.Mixture([X1, X2], weights=[0.4, 0.6]) print(f'mean: {mixture.mean():.2f}, ' f'median: {mixture.median():.2f}, ' f'mode: {mixture.mode():.2f}') x = np.linspace(-10, 10, 300)✓
plt.plot(x, mixture.pdf(x))
plt.title('PDF of normal distribution mixture')
✗
plt.show()
✓
Aliases
-
scipy.stats.Mixture