bundles / scipy latest / scipy / stats / _distribution_infrastructure / truncate
function
scipy.stats._distribution_infrastructure:truncate
Signature
def truncate ( X , lb = -inf , ub = inf ) Summary
Truncate the support of a random variable.
Extended Summary
Given a random variable X, truncate returns a random variable with support truncated to the interval between lb and ub. The underlying probability density function is normalized accordingly.
Parameters
X: `ContinuousDistribution`The random variable to be truncated.
lb, ub: float array-likeThe lower and upper truncation points, respectively. Must be broadcastable with one another and the shape of
X.
Returns
X: `ContinuousDistribution`The truncated random variable.
Notes
Array API Standard Support
truncate has experimental support for Python Array API Standard compatible backends in addition to NumPy. Please consider testing these features by setting an environment variable SCIPY_ARRAY_API=1 and providing CuPy, PyTorch, JAX, or Dask arrays as array arguments. The following combinations of backend and device (or other capability) are supported.
====================  ====================  ====================
Library               CPU                   GPU
====================  ====================  ====================
NumPy                 ✅                     n/a
CuPy                  n/a                   ⛔
PyTorch               ⛔                     ⛔
JAX                   ⛔                     ⛔
Dask                  ⛔                     n/a
====================  ====================  ====================
See
dev-arrayapifor more information.
Examples
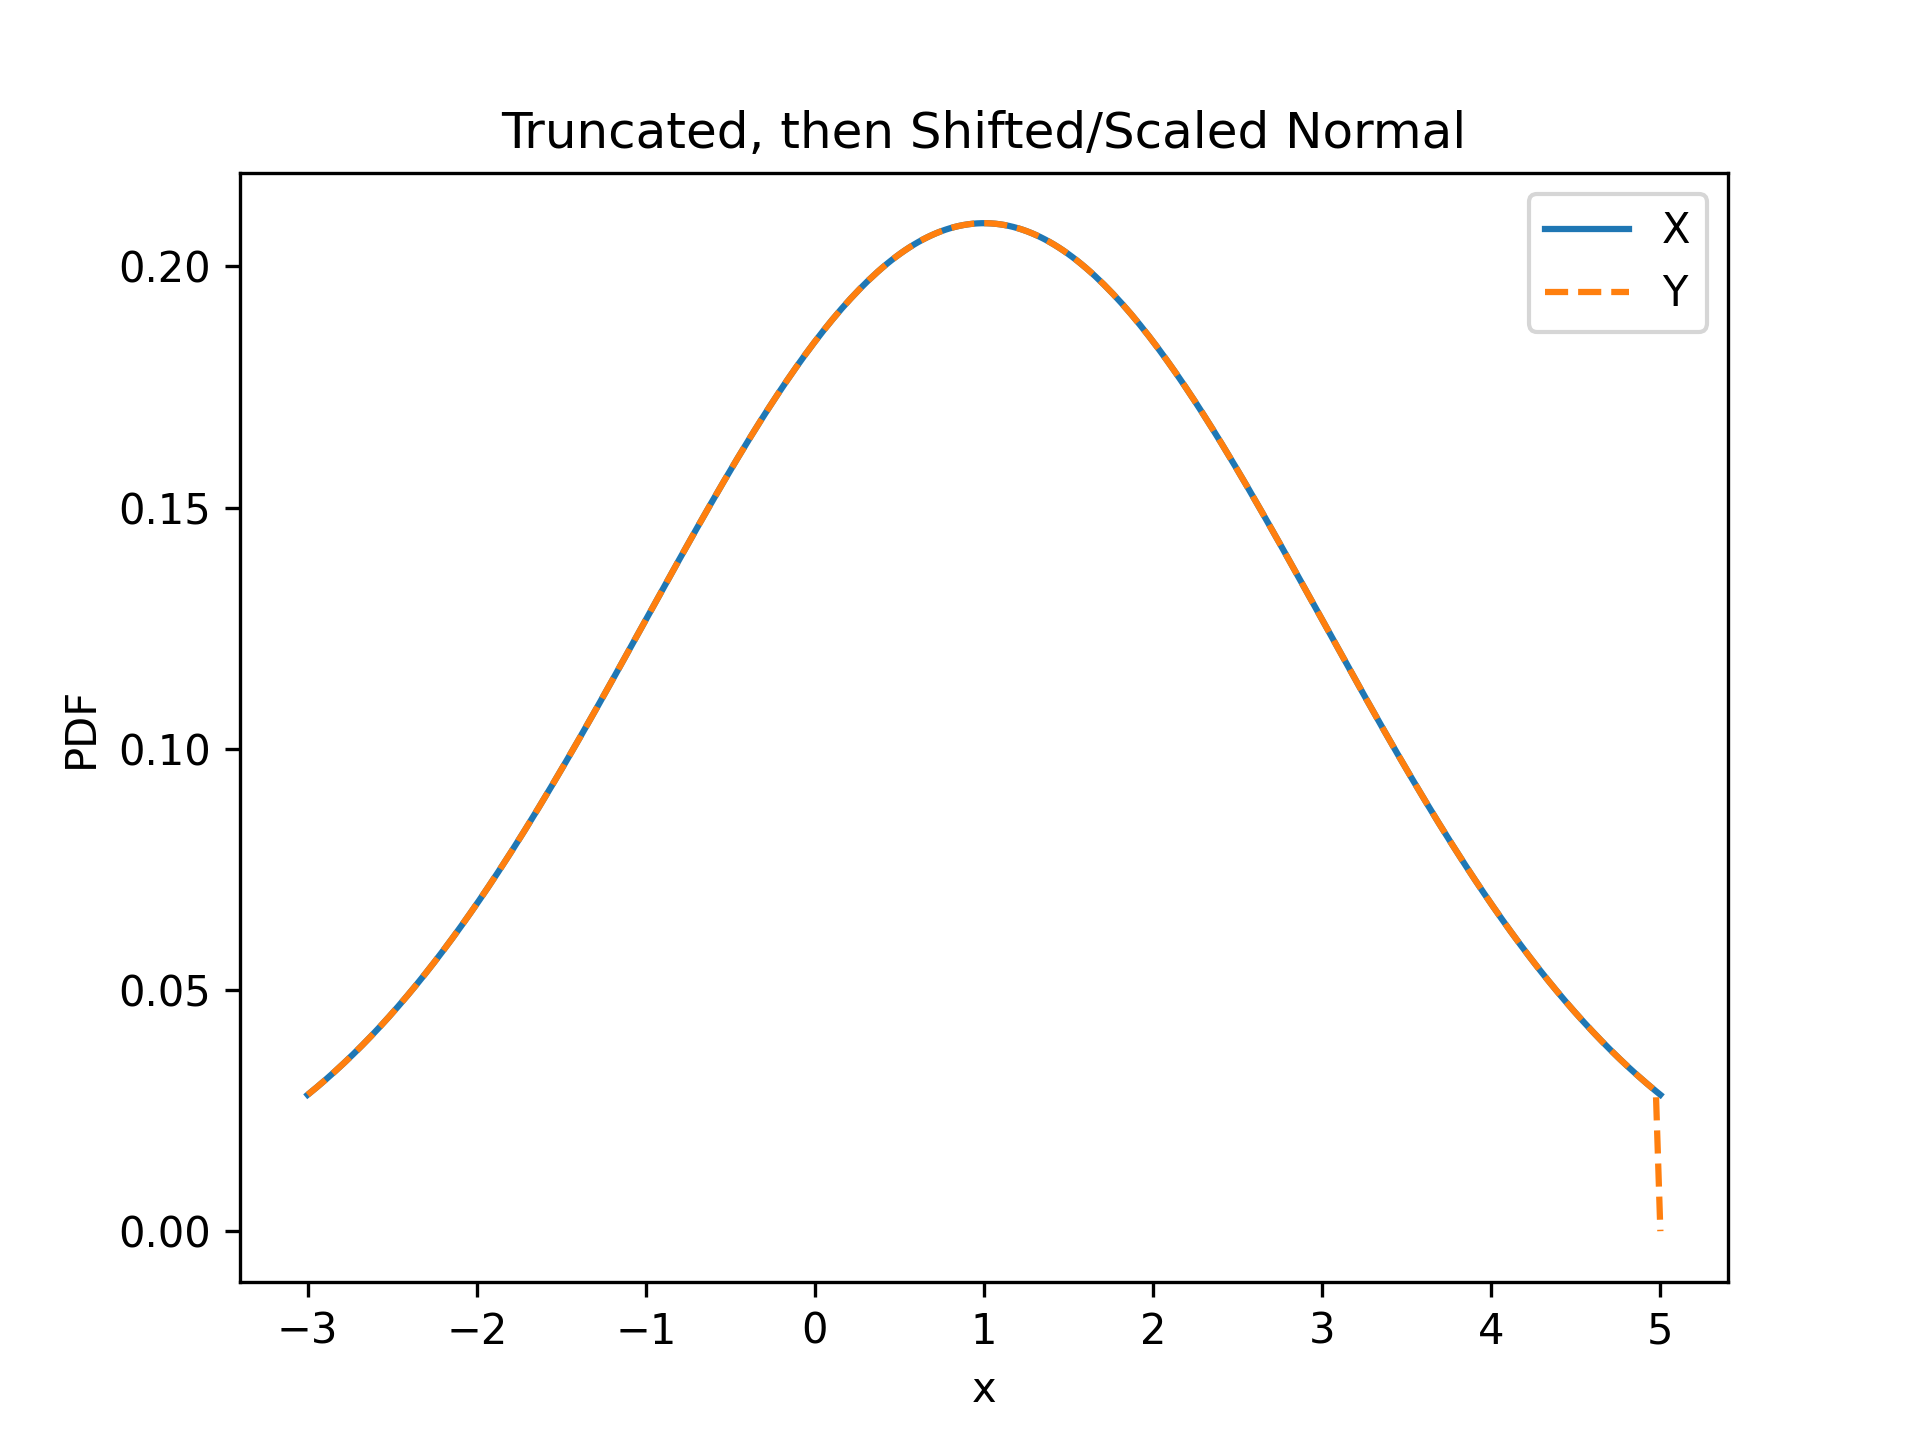
Compare against `scipy.stats.truncnorm`, which truncates a standard normal, *then* shifts and scales it.import numpy as np import matplotlib.pyplot as plt from scipy import stats loc, scale, lb, ub = 1, 2, -2, 2 X = stats.truncnorm(lb, ub, loc, scale) Y = scale * stats.truncate(stats.Normal(), lb, ub) + loc x = np.linspace(-3, 5, 300)✓
plt.plot(x, X.pdf(x), '-', label='X')
plt.plot(x, Y.pdf(x), '--', label='Y')
plt.xlabel('x')
plt.ylabel('PDF')
plt.title('Truncated, then Shifted/Scaled Normal')
plt.legend()
✗
plt.show()
✓
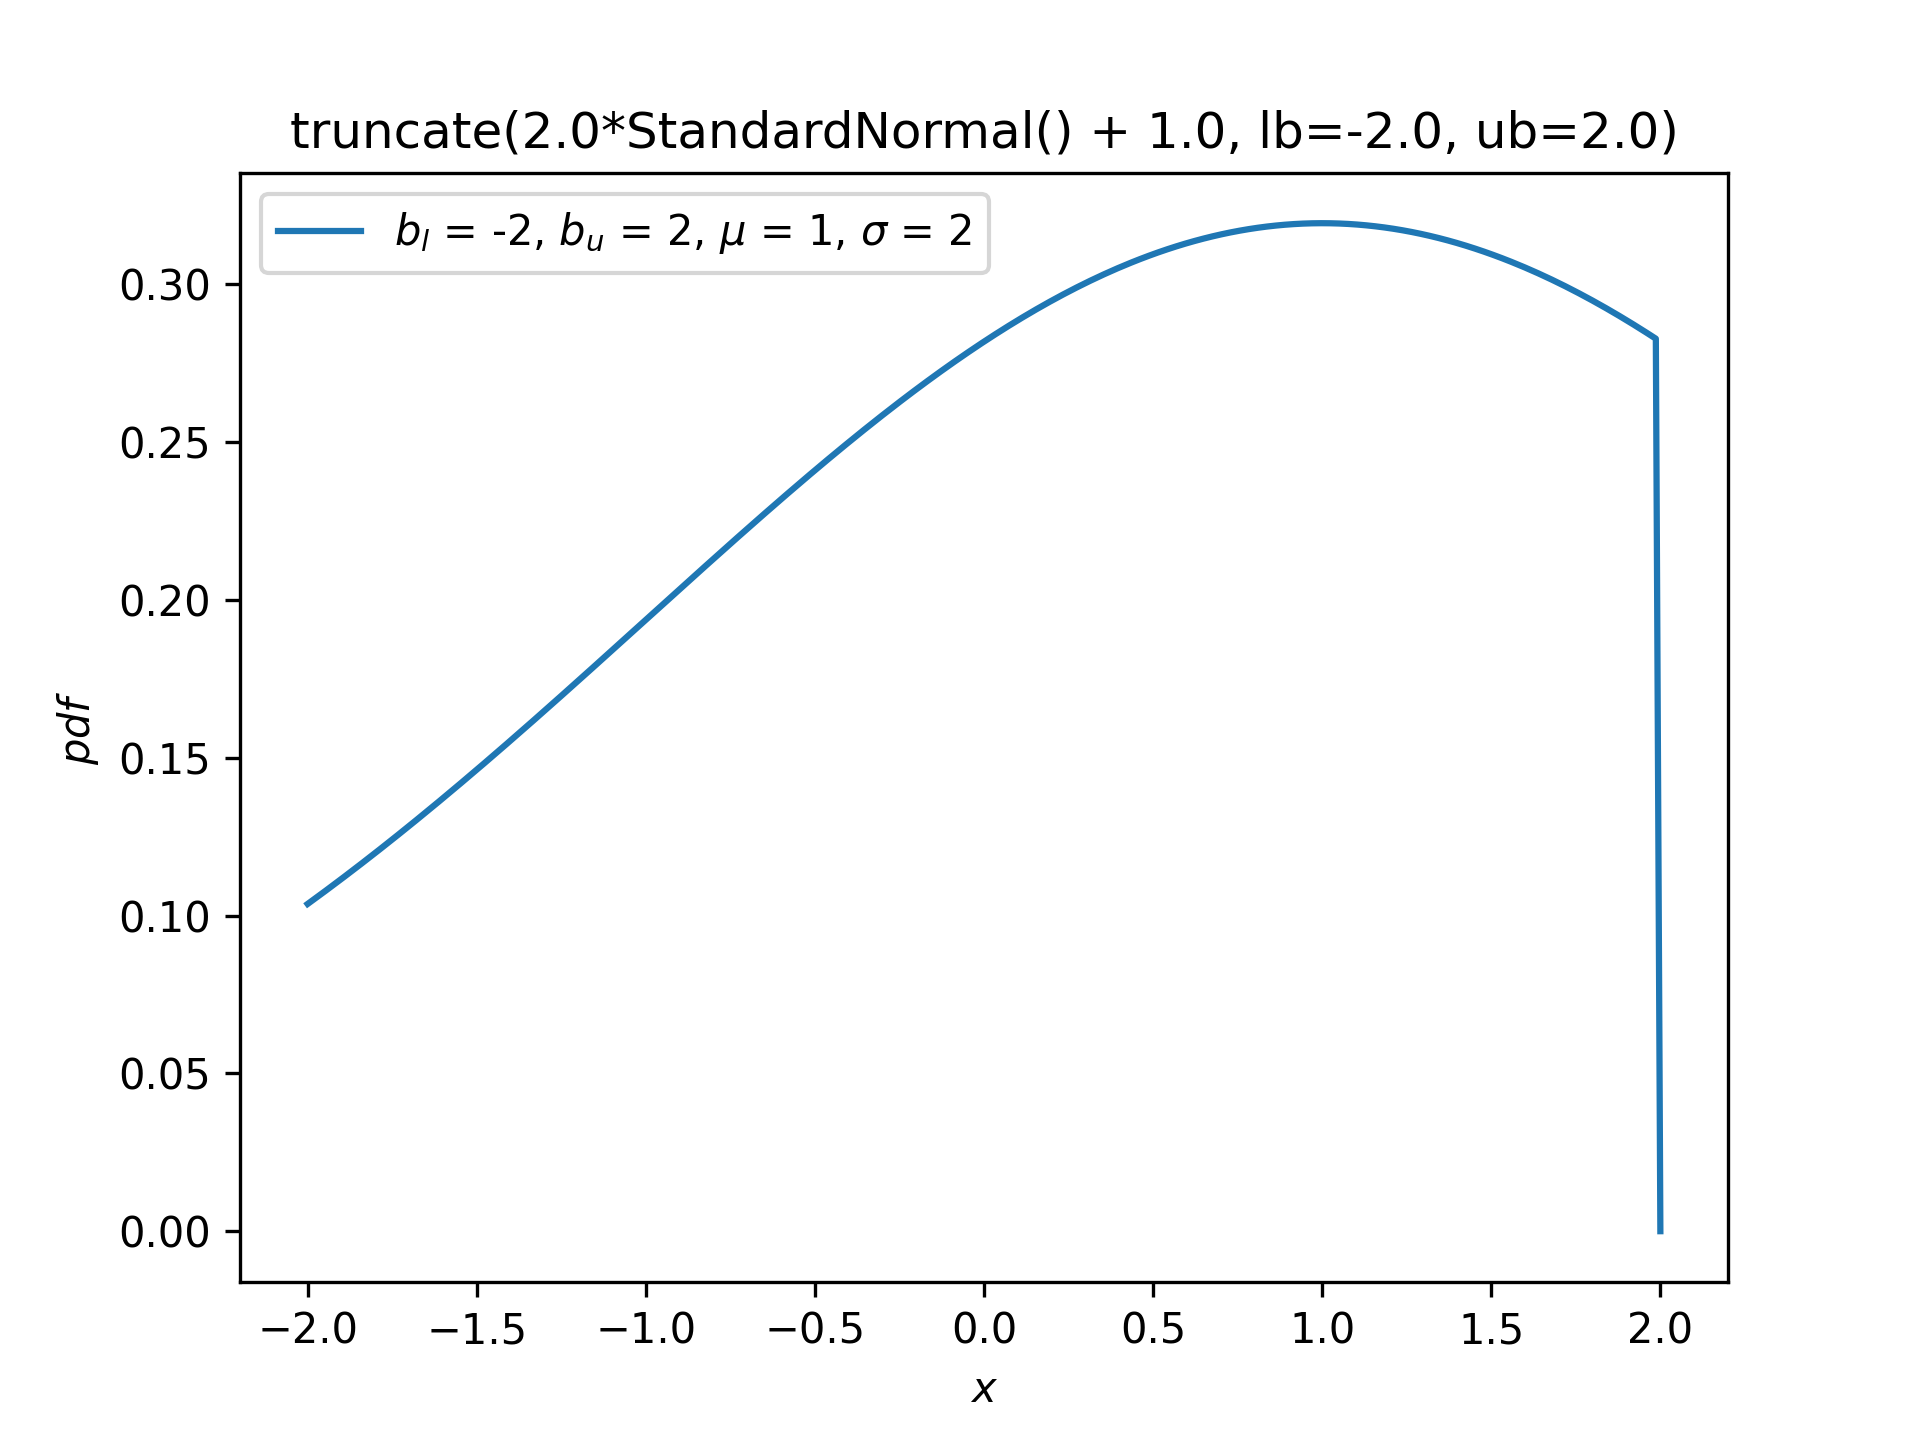
Z = stats.truncate(scale * stats.Normal() + loc, lb, ub)
✓Z.plot()
✗plt.show()
✓
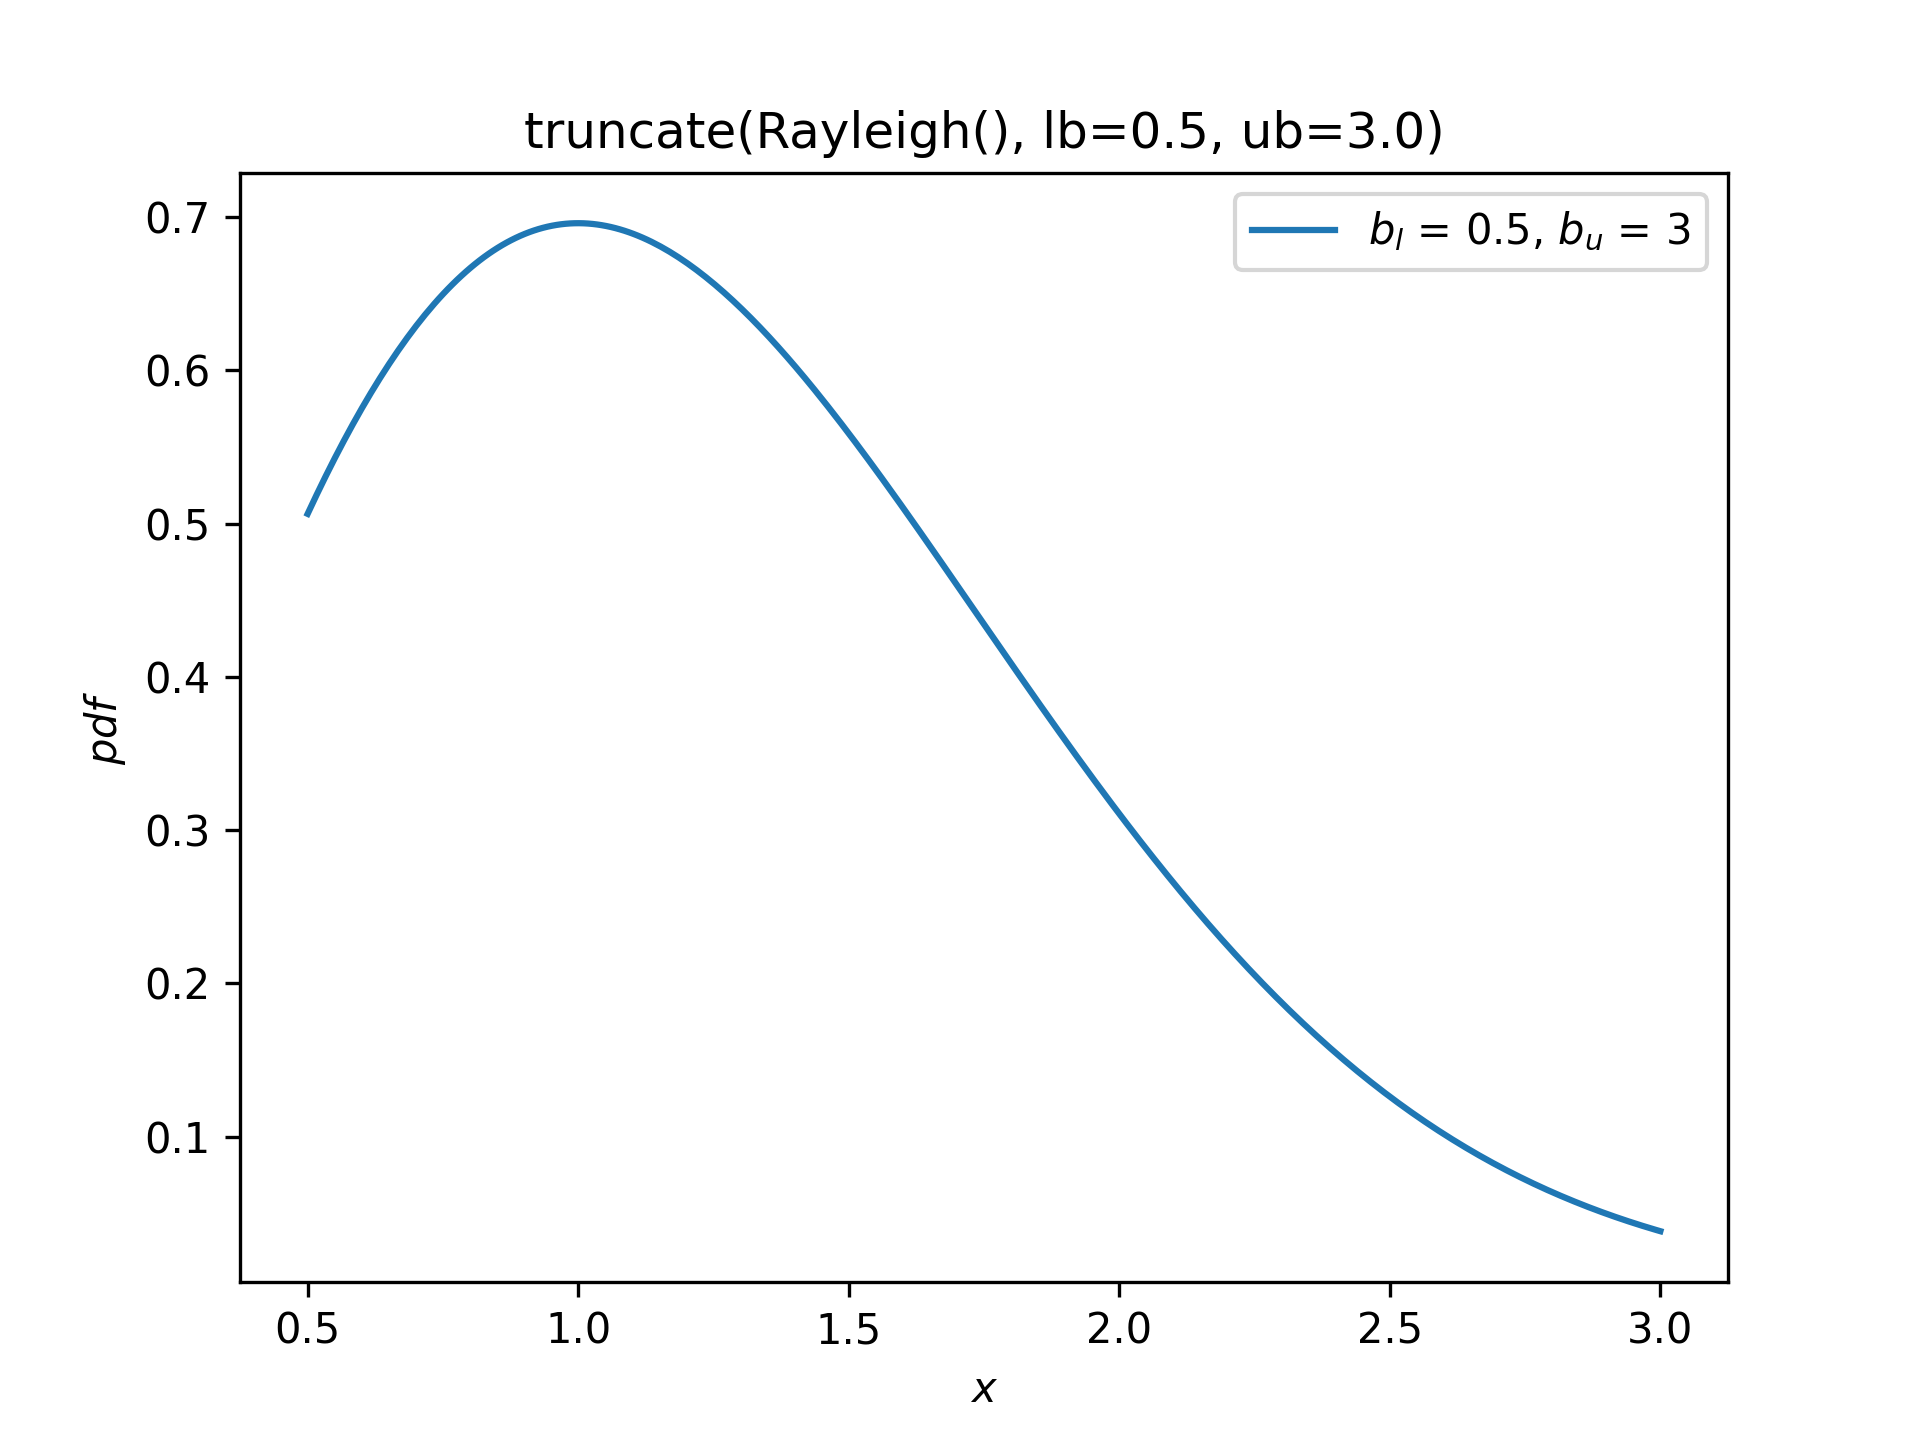
Rayleigh = stats.make_distribution(stats.rayleigh)
W = stats.truncate(Rayleigh(), lb=0.5, ub=3)
✓
W.plot()
✗plt.show()
✓
Aliases
-
scipy.stats.truncate