bundles / scipy latest / scipy / stats / _distribution_infrastructure / OrderStatisticDistribution
ABCMeta
scipy.stats._distribution_infrastructure:OrderStatisticDistribution
source: build-install/usr/lib/python3.14/site-packages/scipy/stats/_distribution_infrastructure.py:4879
Signature
def OrderStatisticDistribution(dist, /, *args, r, n, **kwargs)Members
Summary
Probability distribution of an order statistic.
Extended Summary
An instance of this class represents a random variable that follows the distribution of the order statistic of a sample of observations of a random variable .
Parameters
dist: `ContinuousDistribution`The random variable .
n: array_likeThe (positive integer) sample size .
r: array_likeThe (positive integer) rank of the order statistic , satisfying .
Notes
If we make observations of a continuous random variable and sort them in increasing order , then is known as the order statistic.
If the PDF, CDF, and CCDF of are denoted by , , and , respectively, then the PDF of is given by:
The CDF and other methods of the distribution of are calculated using the fact that , where is a standard uniform random variable, together with the fact that the order statistics of i.i.d. uniform random variables follow a beta distribution .
Examples
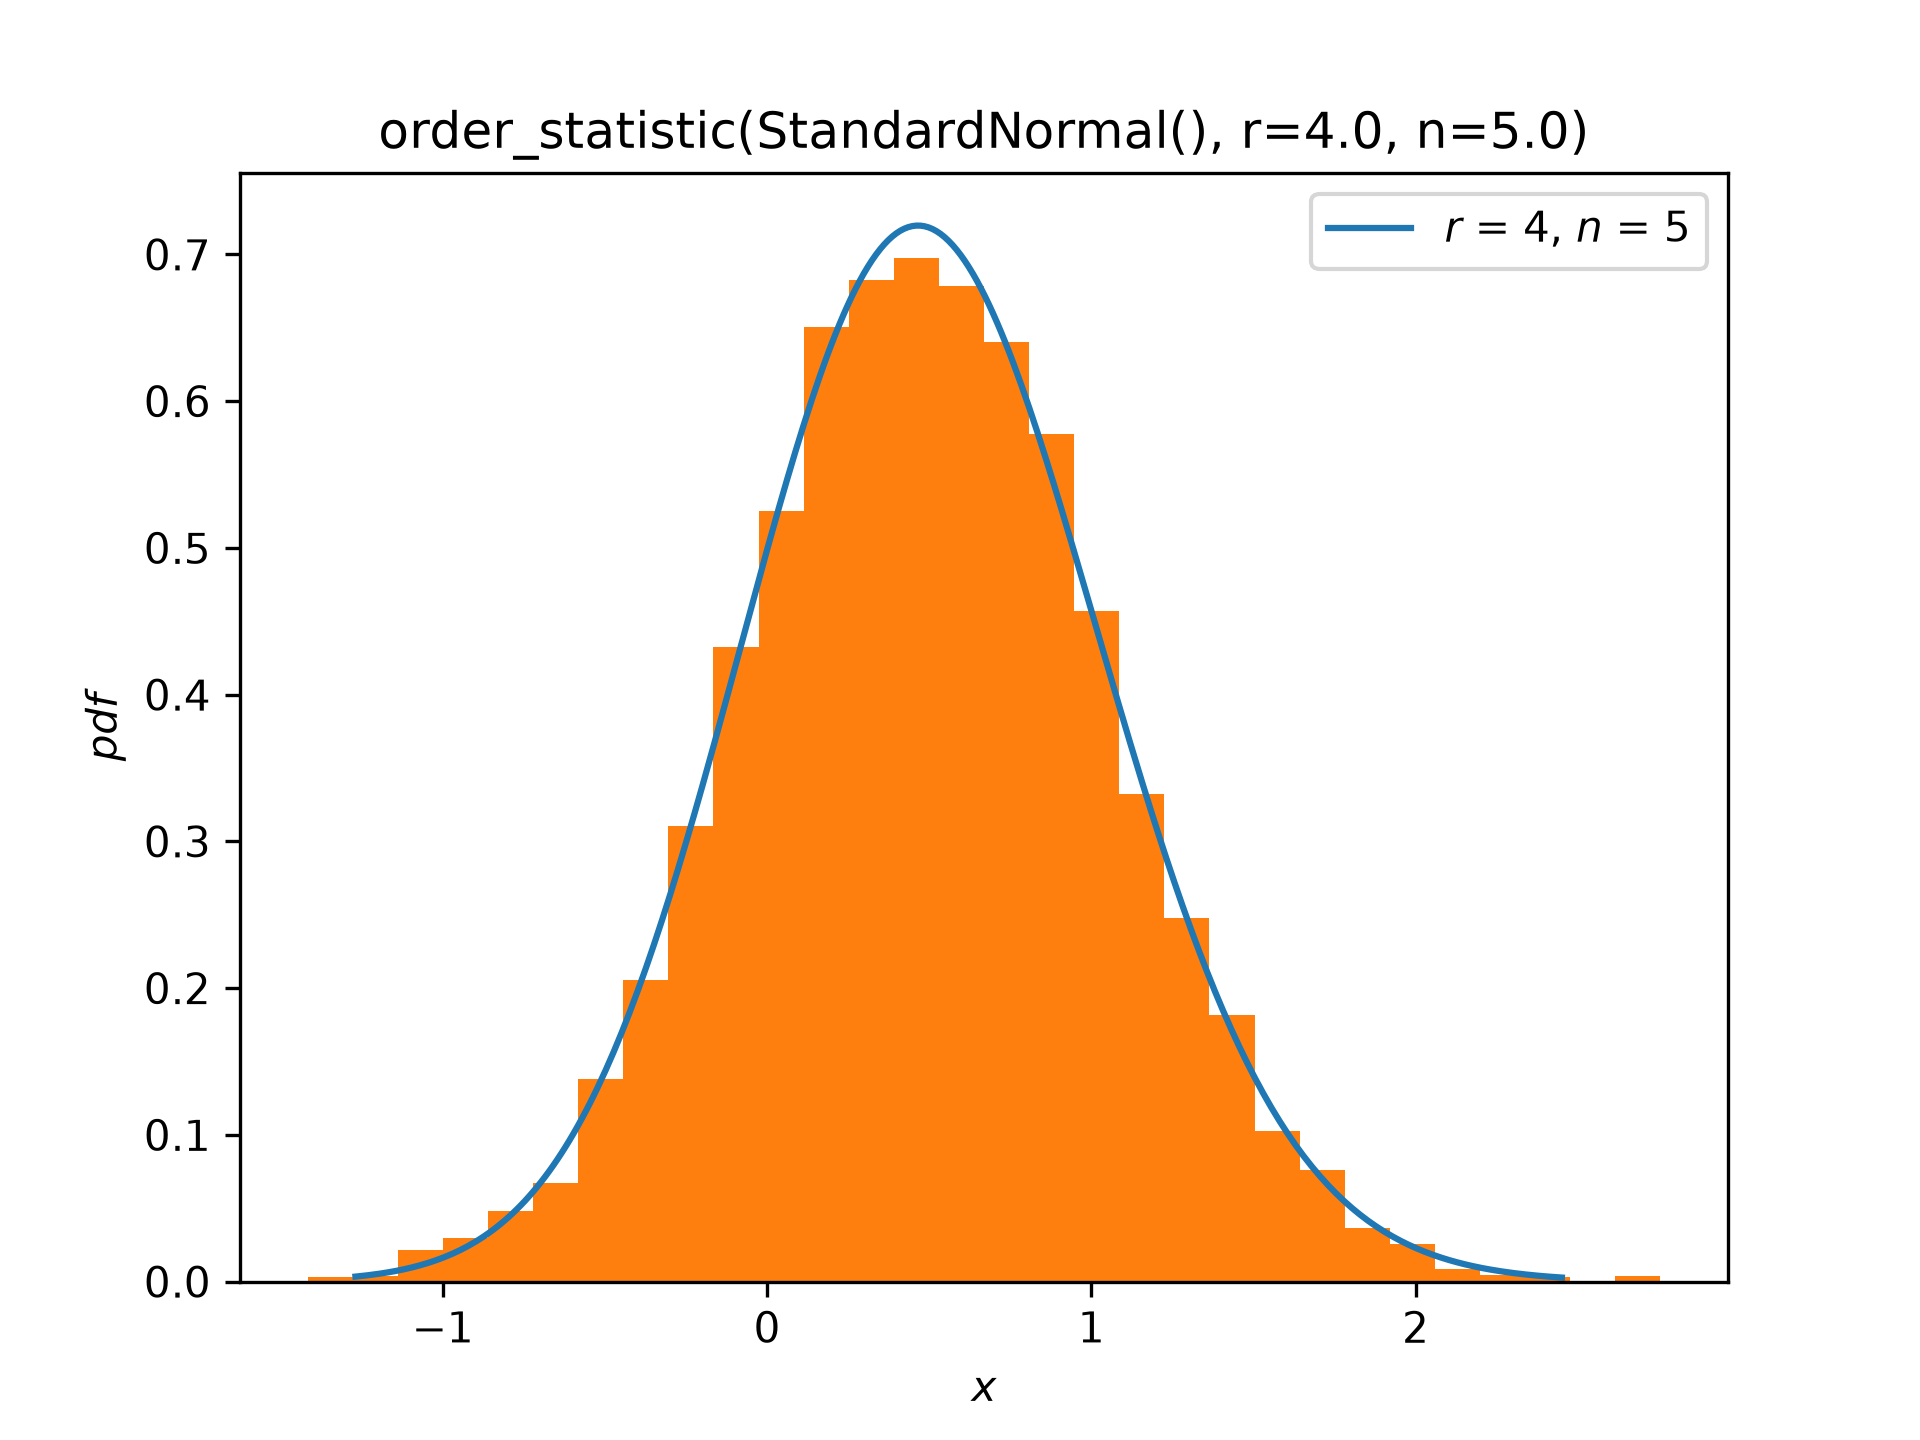
Suppose we are interested in order statistics of samples of size five drawn from the standard normal distribution. Plot the PDF of the fourth order statistic and compare with a normalized histogram from simulation.import numpy as np import matplotlib.pyplot as plt from scipy import stats from scipy.stats._distribution_infrastructure import OrderStatisticDistribution X = stats.Normal() data = X.sample(shape=(10000, 5)) sorted_data = np.sort(data, axis=1) Y = OrderStatisticDistribution(X, r=4, n=5) ax = plt.gca()✓
Y.plot(ax=ax)
ax.hist(sorted_data[:, 3], density=True, bins=30)
✗
(array([0.00288, 0.0036 , 0.02157, 0.02948, 0.04818, 0.06688, 0.13807,
       0.20567, 0.31067, 0.4322 , 0.52497, 0.65082, 0.68246, 0.69757,
       0.67815, 0.64003, 0.57747, 0.45665, 0.33224, 0.2481 , 0.18194,
       0.10284, 0.07623, 0.03668, 0.02589, 0.00863, 0.00431, 0.00288,
       0.00072, 0.0036 ]), array([-1.41688, -1.27783, -1.13877, -0.99972, -0.86066, -0.72161,
       -0.58255, -0.4435 , -0.30444, -0.16539, -0.02633,  0.11272,
        0.25178,  0.39084,  0.52989,  0.66895,  0.808  ,  0.94706,
        1.08611,  1.22517,  1.36422,  1.50328,  1.64233,  1.78139,
        1.92044,  2.0595 ,  2.19855,  2.33761,  2.47666,  2.61572,
        2.75477]), <BarContainer object of 30 artists>)
plt.show()
✓
Aliases
scipy.stats._distribution_infrastructure.OrderStatisticDistribution