bundles / scipy latest / scipy / stats / _distribution_infrastructure / order_statistic
function
scipy.stats._distribution_infrastructure:order_statistic
Signature
def order_statistic ( X , / , r , n ) Summary
Probability distribution of an order statistic
Extended Summary
Returns a random variable that follows the distribution underlying the order statistic of a sample of observations of a random variable .
Parameters
X: `ContinuousDistribution`The random variable
r: array_likeThe (positive integer) rank of the order statistic
n: array_likeThe (positive integer) sample size
Returns
Y: `ContinuousDistribution`A random variable that follows the distribution of the prescribed order statistic.
Notes
If we make observations of a continuous random variable and sort them in increasing order , is known as the order statistic.
If the PDF, CDF, and CCDF underlying math:X are denoted , , and , respectively, then the PDF underlying math:X_{(r)} is given by:
The CDF and other methods of the distribution underlying are calculated using the fact that , where is a standard uniform random variable, and that the order statistics of observations of U follow a beta distribution, .
Array API Standard Support
order_statistic has experimental support for Python Array API Standard compatible backends in addition to NumPy. Please consider testing these features by setting an environment variable SCIPY_ARRAY_API=1 and providing CuPy, PyTorch, JAX, or Dask arrays as array arguments. The following combinations of backend and device (or other capability) are supported.
====================  ====================  ====================
Library               CPU                   GPU
====================  ====================  ====================
NumPy                 ✅                     n/a
CuPy                  n/a                   ⛔
PyTorch               ⛔                     ⛔
JAX                   ⛔                     ⛔
Dask                  ⛔                     n/a
====================  ====================  ====================
See
dev-arrayapifor more information.
Examples
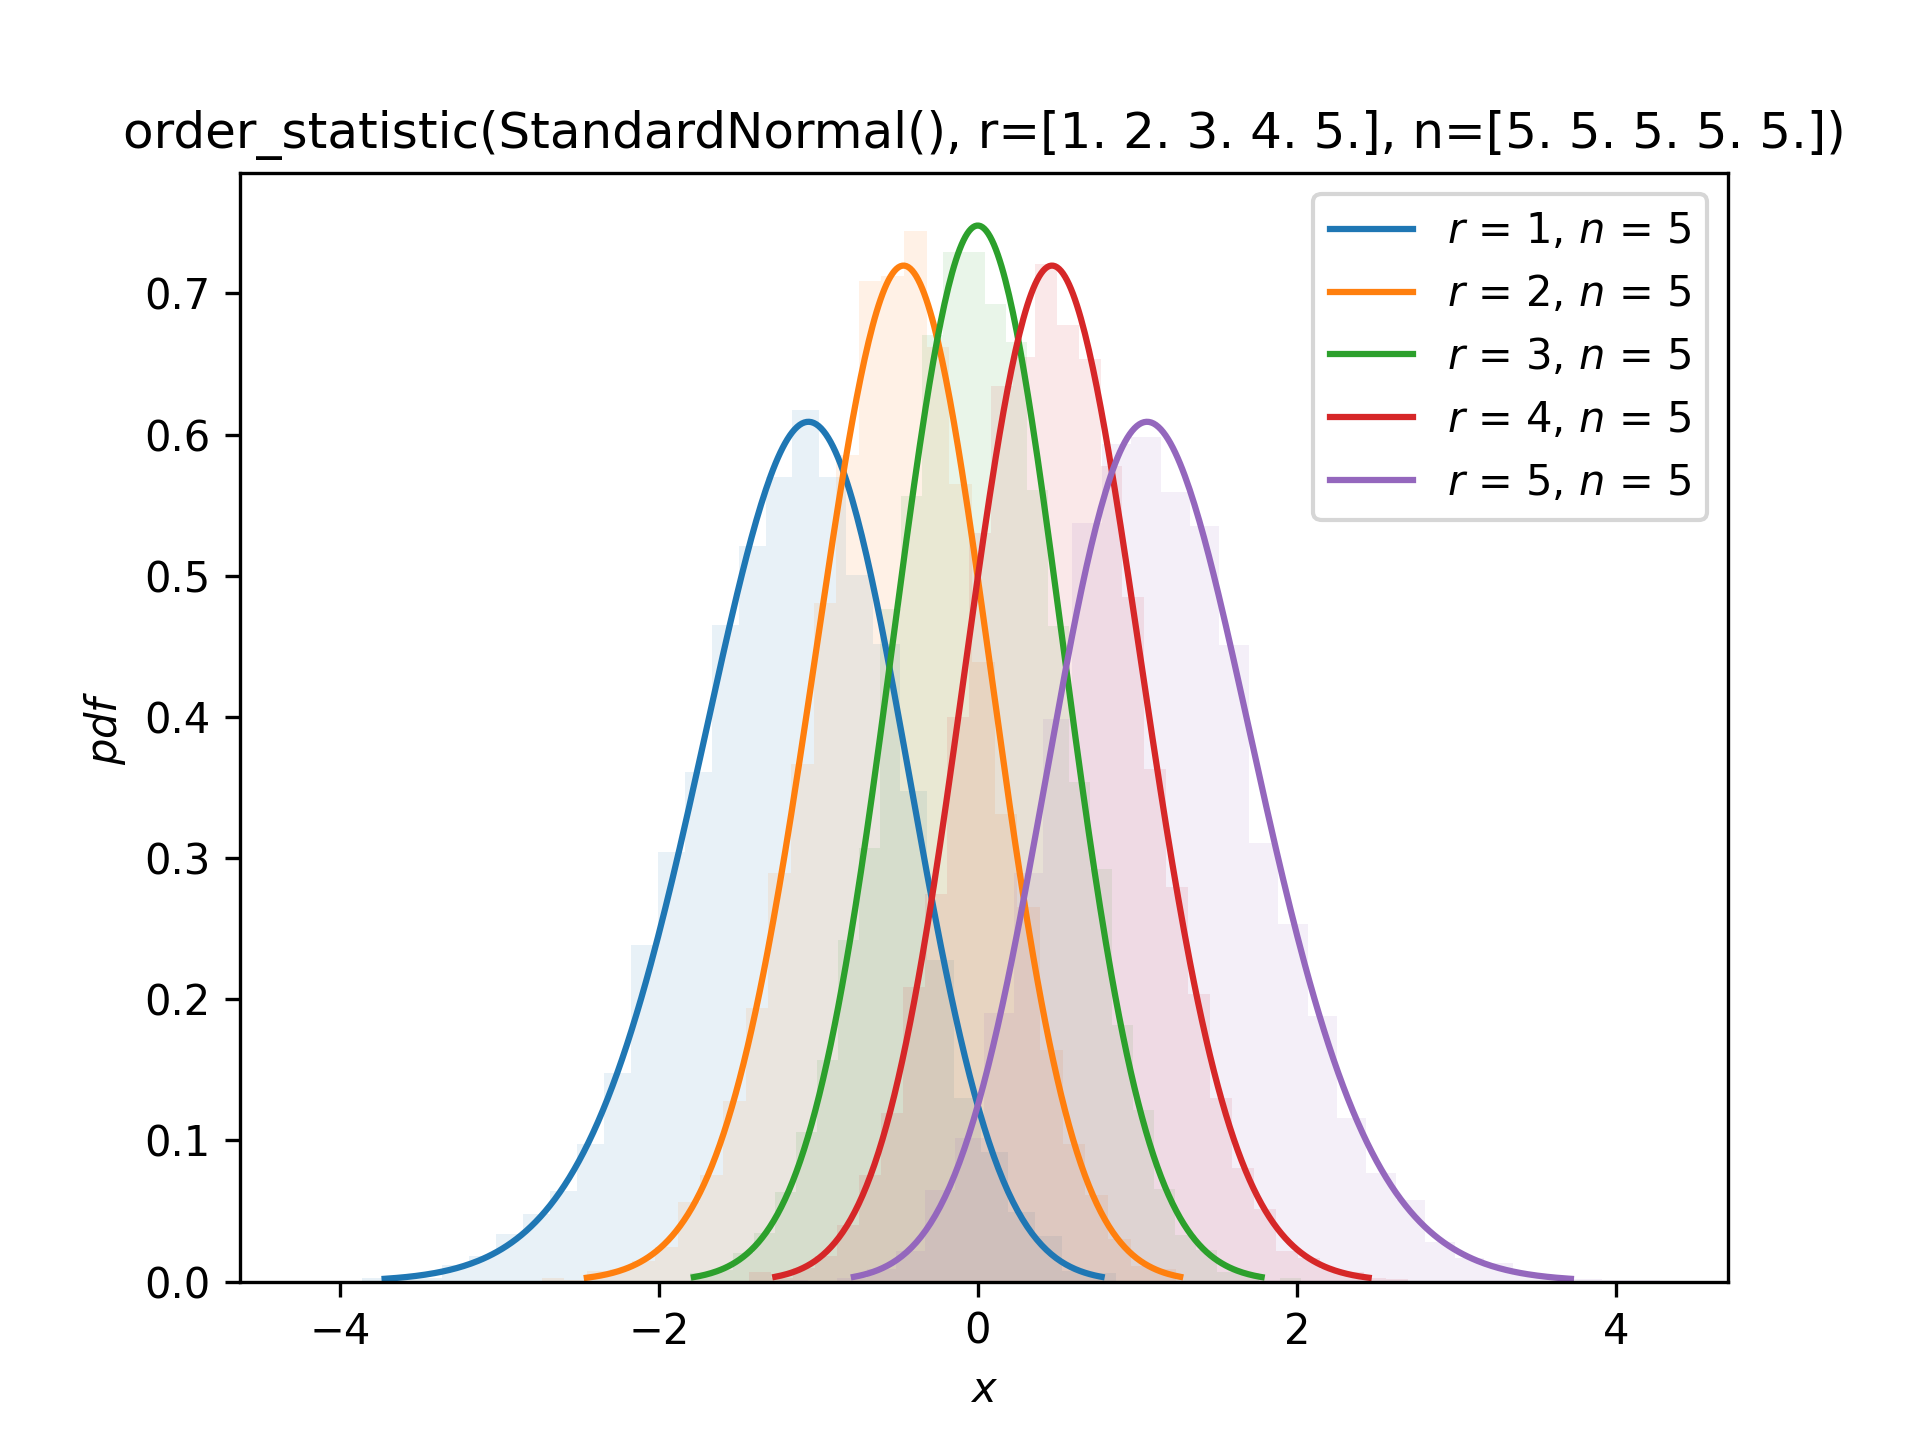
Suppose we are interested in order statistics of samples of size five drawn from the standard normal distribution. Plot the PDF underlying each order statistic and compare with a normalized histogram from simulation.import numpy as np import matplotlib.pyplot as plt from scipy import stats X = stats.Normal() data = X.sample(shape=(10000, 5)) sorted = np.sort(data, axis=1) Y = stats.order_statistic(X, r=[1, 2, 3, 4, 5], n=5) ax = plt.gca() colors = plt.rcParams['axes.prop_cycle'].by_key()['color']✓
for i in range(5):
    y = sorted[:, i]
    ax.hist(y, density=True, bins=30, alpha=0.1, color=colors[i])
Y.plot(ax=ax)
✗
plt.show()
✓
Aliases
-
scipy.stats.order_statistic