bundles / scipy latest / scipy / stats / _morestats / boxcox_normplot
function
scipy.stats._morestats:boxcox_normplot
source: /scipy/stats/_morestats.py :1505
Signature
def boxcox_normplot ( x , la , lb , plot = None , N = 80 ) Summary
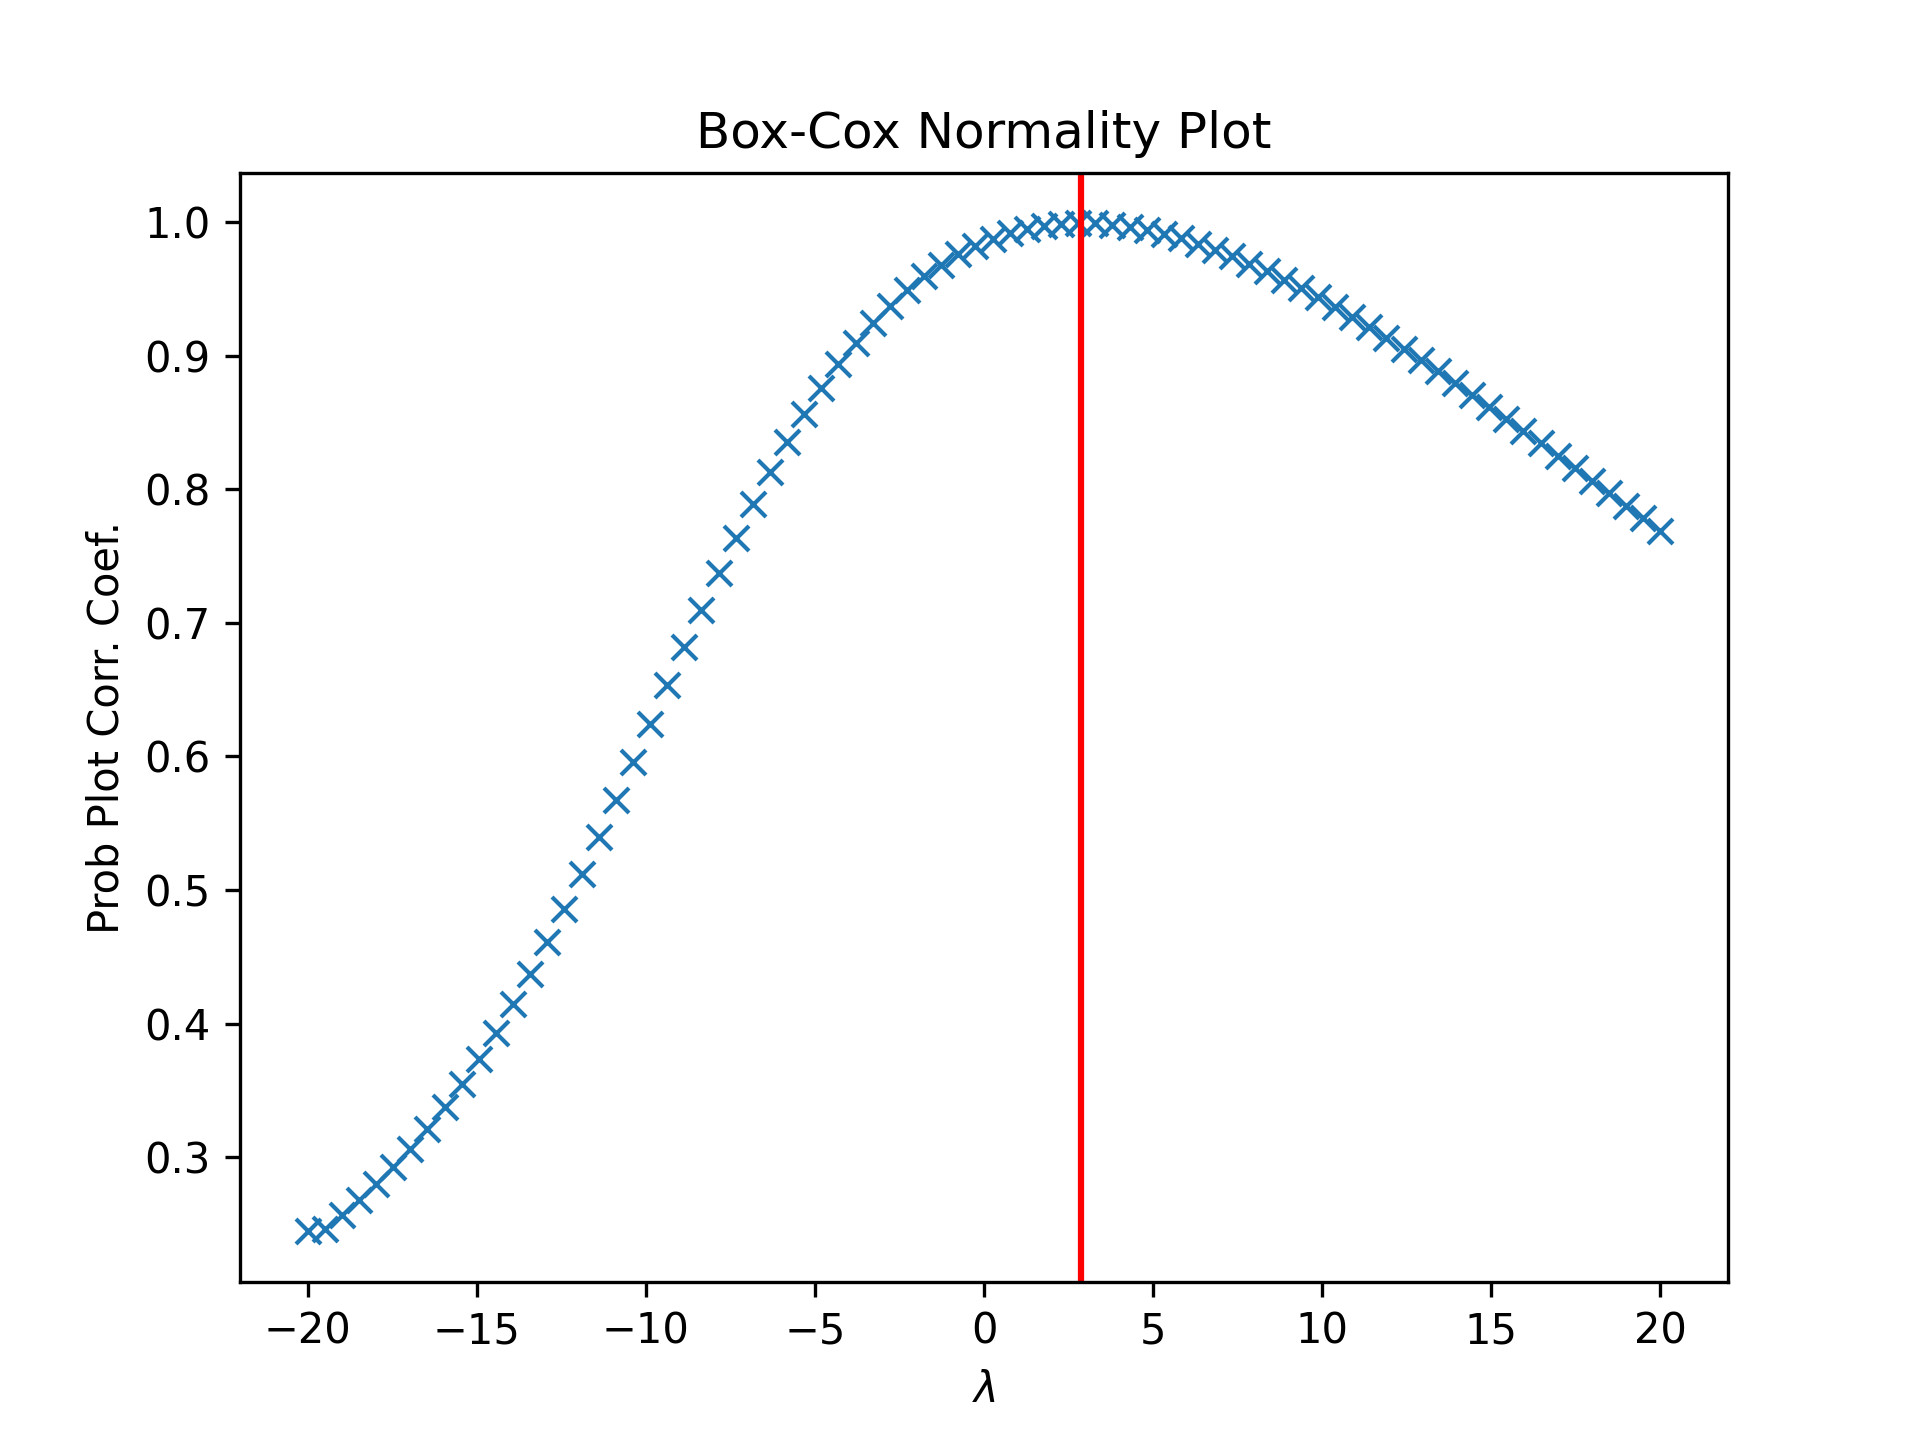
Compute parameters for a Box-Cox normality plot, optionally show it.
Extended Summary
A Box-Cox normality plot shows graphically what the best transformation parameter is to use in boxcox to obtain a distribution that is close to normal.
Parameters
x: array_likeInput array.
la, lb: scalarThe lower and upper bounds for the
lmbdavalues to pass toboxcoxfor Box-Cox transformations. These are also the limits of the horizontal axis of the plot if that is generated.plot: object, optionalIf given, plots the quantiles and least squares fit.
plotis an object that has to have methods "plot" and "text". The matplotlib.pyplot module or a Matplotlib Axes object can be used, or a custom object with the same methods. Default is None, which means that no plot is created.N: int, optionalNumber of points on the horizontal axis (equally distributed from
latolb).
Returns
lmbdas: ndarrayThe
lmbdavalues for which a Box-Cox transform was done.ppcc: ndarrayProbability Plot Correlation Coefficient, as obtained from probplot when fitting the Box-Cox transformed input
xagainst a normal distribution.
Notes
Even if plot is given, the figure is not shown or saved by boxcox_normplot; plt.show() or plt.savefig('figname.png') should be used after calling probplot.
Array API Standard Support
boxcox_normplot has experimental support for Python Array API Standard compatible backends in addition to NumPy. Please consider testing these features by setting an environment variable SCIPY_ARRAY_API=1 and providing CuPy, PyTorch, JAX, or Dask arrays as array arguments. The following combinations of backend and device (or other capability) are supported.
====================  ====================  ====================
Library               CPU                   GPU
====================  ====================  ====================
NumPy                 ✅                     n/a
CuPy                  n/a                   ⛔
PyTorch               ⛔                     ⛔
JAX                   ⛔                     ⛔
Dask                  ⛔                     n/a
====================  ====================  ====================
See
dev-arrayapifor more information.
Examples
from scipy import stats
import matplotlib.pyplot as plt
✓
x = stats.loggamma.rvs(5, size=500) + 5
fig = plt.figure()
ax = fig.add_subplot(111)
prob = stats.boxcox_normplot(x, -20, 20, plot=ax)
✓
_, maxlog = stats.boxcox(x)
✓ax.axvline(maxlog, color='r')
✗plt.show()
✓
See also
Aliases
-
scipy.stats.boxcox_normplot