bundles / scipy latest / scipy / stats / _morestats / yeojohnson_normmax
function
scipy.stats._morestats:yeojohnson_normmax
source: /scipy/stats/_morestats.py :1839
Signature
def yeojohnson_normmax ( x , brack = None ) Summary
Compute optimal Yeo-Johnson transform parameter.
Extended Summary
Compute optimal Yeo-Johnson transform parameter for input data, using maximum likelihood estimation.
Parameters
x: array_likeInput array.
brack: 2-tuple, optionalThe starting interval for a downhill bracket search with optimize.brent. Note that this is in most cases not critical; the final result is allowed to be outside this bracket. If None, optimize.fminbound is used with bounds that avoid overflow.
Returns
maxlog: floatThe optimal transform parameter found.
Notes
Array API Standard Support
yeojohnson_normmax has experimental support for Python Array API Standard compatible backends in addition to NumPy. Please consider testing these features by setting an environment variable SCIPY_ARRAY_API=1 and providing CuPy, PyTorch, JAX, or Dask arrays as array arguments. The following combinations of backend and device (or other capability) are supported.
====================  ====================  ====================
Library               CPU                   GPU
====================  ====================  ====================
NumPy                 ✅                     n/a
CuPy                  n/a                   ⛔
PyTorch               ⛔                     ⛔
JAX                   ⛔                     ⛔
Dask                  ⛔                     n/a
====================  ====================  ====================
See
dev-arrayapifor more information.
Examples
import numpy as np
from scipy import stats
import matplotlib.pyplot as plt
✓
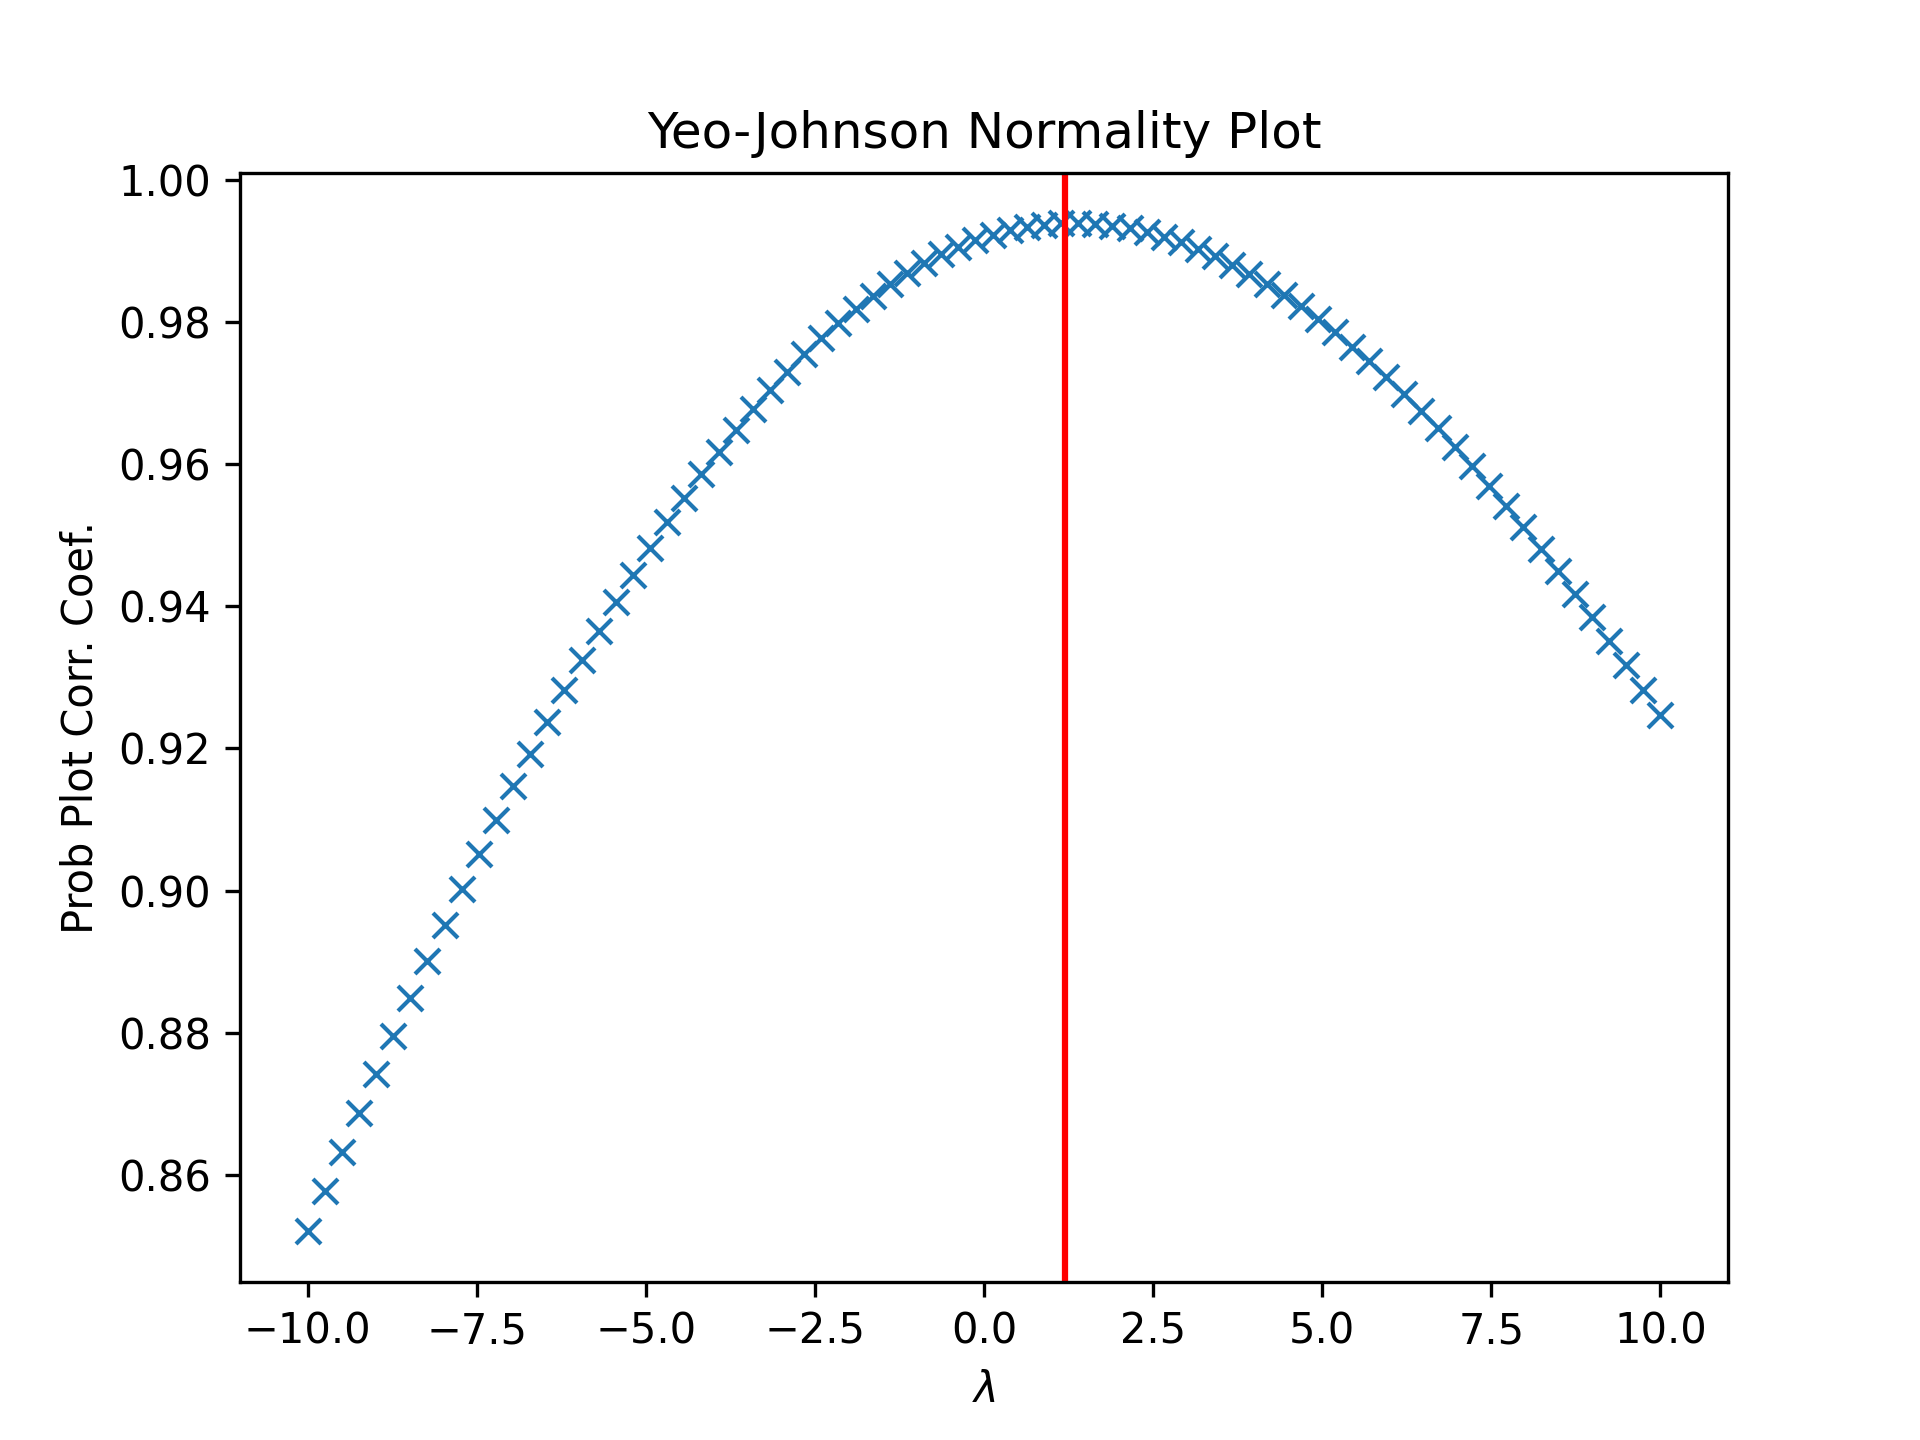
rng = np.random.default_rng()
x = stats.loggamma.rvs(5, size=30, random_state=rng) + 5
lmax = stats.yeojohnson_normmax(x)
✓
fig = plt.figure()
ax = fig.add_subplot(111)
prob = stats.yeojohnson_normplot(x, -10, 10, plot=ax)
✓
ax.axvline(lmax, color='r')
✗plt.show()
✓
See also
Aliases
-
scipy.stats.yeojohnson_normmax