bundles / scipy latest / scipy / interpolate / _fitpack2 / InterpolatedUnivariateSpline
class
scipy.interpolate._fitpack2:InterpolatedUnivariateSpline
Signature
class InterpolatedUnivariateSpline ( x , y , w = None , bbox = [None, None] , k = 3 , ext = 0 , check_finite = False ) Members
Summary
1-D interpolating spline for a given set of data points.
Extended Summary
Fits a spline y = spl(x) of degree k to the provided x, y data. Spline function passes through all provided points. Equivalent to UnivariateSpline with s = 0.
Parameters
x: (N,) array_likeInput dimension of data points -- must be strictly increasing
y: (N,) array_likeinput dimension of data points
w: (N,) array_like, optionalWeights for spline fitting. Must be positive. If None (default), weights are all 1.
bbox: (2,) array_like, optional2-sequence specifying the boundary of the approximation interval. If None (default),
bbox=[x[0], x[-1]].k: int, optionalDegree of the smoothing spline. Must be
1 <= k <= 5. Default isk = 3, a cubic spline.ext: int or str, optionalControls the extrapolation mode for elements not in the interval defined by the knot sequence.
if ext=0 or 'extrapolate', return the extrapolated value.
if ext=1 or 'zeros', return 0
if ext=2 or 'raise', raise a ValueError
if ext=3 of 'const', return the boundary value.
The default value is 0.
check_finite: bool, optionalWhether to check that the input arrays contain only finite numbers. Disabling may give a performance gain, but may result in problems (crashes, non-termination or non-sensical results) if the inputs do contain infinities or NaNs. Default is False.
Notes
The number of data points must be larger than the spline degree k.
Array API Standard Support
InterpolatedUnivariateSpline is not in-scope for support of Python Array API Standard compatible backends other than NumPy.
See dev-arrayapi for more information.
Examples
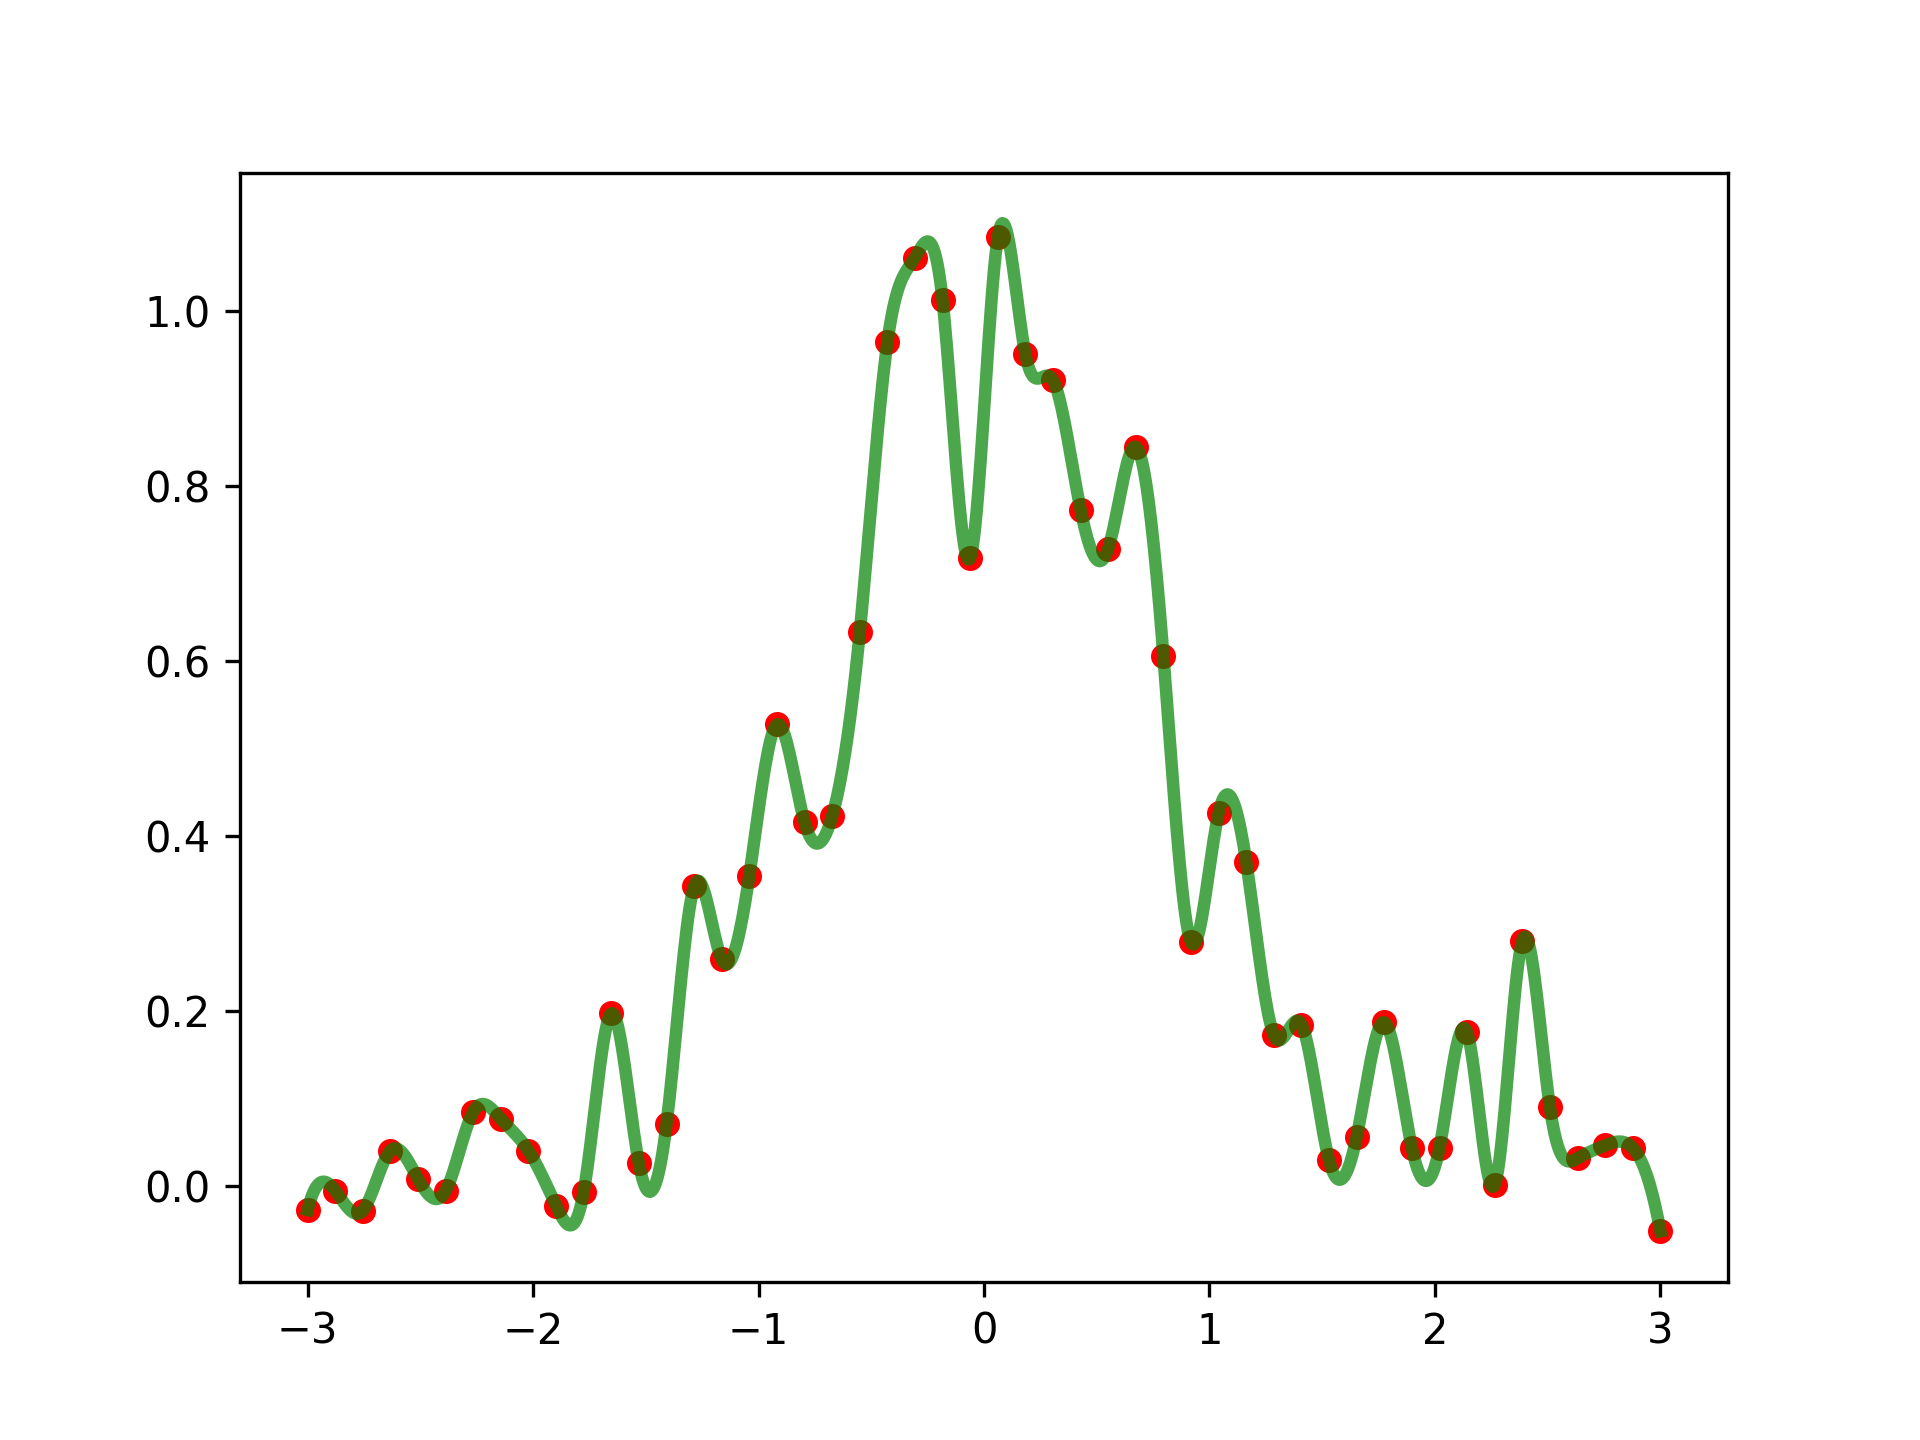
import numpy as np
import matplotlib.pyplot as plt
from scipy.interpolate import InterpolatedUnivariateSpline
rng = np.random.default_rng()
x = np.linspace(-3, 3, 50)
y = np.exp(-x**2) + 0.1 * rng.standard_normal(50)
spl = InterpolatedUnivariateSpline(x, y)
✓
plt.plot(x, y, 'ro', ms=5)
✗xs = np.linspace(-3, 3, 1000)
✓plt.plot(xs, spl(xs), 'g', lw=3, alpha=0.7)
✗plt.show()
✓
spl.get_residual()
✓See also
- LSQBivariateSpline
a bivariate spline using weighted least-squares fitting
- LSQUnivariateSpline
a spline for which knots are user-selected
- SmoothBivariateSpline
a smoothing bivariate spline through the given points
- UnivariateSpline
a smooth univariate spline to fit a given set of data points.
- spalde
a function to evaluate all derivatives of a B-spline
- splev
a function to evaluate a B-spline or its derivatives
- splint
a function to evaluate the definite integral of a B-spline between two given points
- splrep
a function to find the B-spline representation of a 1-D curve
- sproot
a function to find the roots of a cubic B-spline
Aliases
-
scipy.interpolate.InterpolatedUnivariateSpline