bundles / scipy latest / scipy / interpolate / _fitpack2 / UnivariateSpline
class
scipy.interpolate._fitpack2:UnivariateSpline
Signature
class UnivariateSpline ( x , y , w = None , bbox = [None, None] , k = 3 , s = None , ext = 0 , check_finite = False ) Members
-
__call__ -
__init__ -
_from_tck -
_reset_class -
_reset_nest -
_set_class -
antiderivative -
derivative -
derivatives -
get_coeffs -
get_knots -
get_residual -
integral -
roots -
set_smoothing_factor -
validate_input
Summary
1-D smoothing spline fit to a given set of data points.
Extended Summary
Fits a spline y = spl(x) of degree k to the provided x, y data. s specifies the number of knots by specifying a smoothing condition.
Parameters
x: (N,) array_like1-D array of independent input data. Must be increasing; must be strictly increasing if
sis 0.y: (N,) array_like1-D array of dependent input data, of the same length as
x.w: (N,) array_like, optionalWeights for spline fitting. Must be positive. If
wis None, weights are all 1. Default is None.bbox: (2,) array_like, optional2-sequence specifying the boundary of the approximation interval. If
bboxis None,bbox=[x[0], x[-1]]. Default is None.k: int, optionalDegree of the smoothing spline. Must be 1 <=
k<= 5.k = 3is a cubic spline. Default is 3.s: float or None, optionalPositive smoothing factor used to choose the number of knots. Number of knots will be increased until the smoothing condition is satisfied
sum((w[i] * (y[i]-spl(x[i])))**2, axis=0) <= sHowever, because of numerical issues, the actual condition is
abs(sum((w[i] * (y[i]-spl(x[i])))**2, axis=0) - s) < 0.001 * sIf
sis None,swill be set aslen(w)for a smoothing spline that uses all data points. If 0, spline will interpolate through all data points. This is equivalent to InterpolatedUnivariateSpline. Default is None. The user can use thesto control the tradeoff between closeness and smoothness of fit. Largersmeans more smoothing while smaller values ofsindicate less smoothing. Recommended values ofsdepend on the weights,w. If the weights represent the inverse of the standard-deviation ofy, then a goodsvalue should be found in the range (m-sqrt(2*m),m+sqrt(2*m)) where m is the number of datapoints inx,y, andw. This meanss = len(w)should be a good value if1/w[i]is an estimate of the standard deviation ofy[i].ext: int or str, optionalControls the extrapolation mode for elements not in the interval defined by the knot sequence.
if ext=0 or 'extrapolate', return the extrapolated value.
if ext=1 or 'zeros', return 0
if ext=2 or 'raise', raise a ValueError
if ext=3 or 'const', return the boundary value.
Default is 0.
check_finite: bool, optionalWhether to check that the input arrays contain only finite numbers. Disabling may give a performance gain, but may result in problems (crashes, non-termination or non-sensical results) if the inputs do contain infinities or NaNs. Default is False.
Notes
The number of data points must be larger than the spline degree k.
NaN handling: If the input arrays contain nan values, the result is not useful, since the underlying spline fitting routines cannot deal with nan. A workaround is to use zero weights for not-a-number data points:
>>> import numpy as np
>>> from scipy.interpolate import UnivariateSpline
>>> x, y = np.array([1, 2, 3, 4]), np.array([1, np.nan, 3, 4])
>>> w = np.isnan(y)
>>> y[w] = 0.
>>> spl = UnivariateSpline(x, y, w=~w)
Notice the need to replace a nan by a numerical value (precise value does not matter as long as the corresponding weight is zero.)
Array API Standard Support
UnivariateSpline is not in-scope for support of Python Array API Standard compatible backends other than NumPy.
See dev-arrayapi for more information.
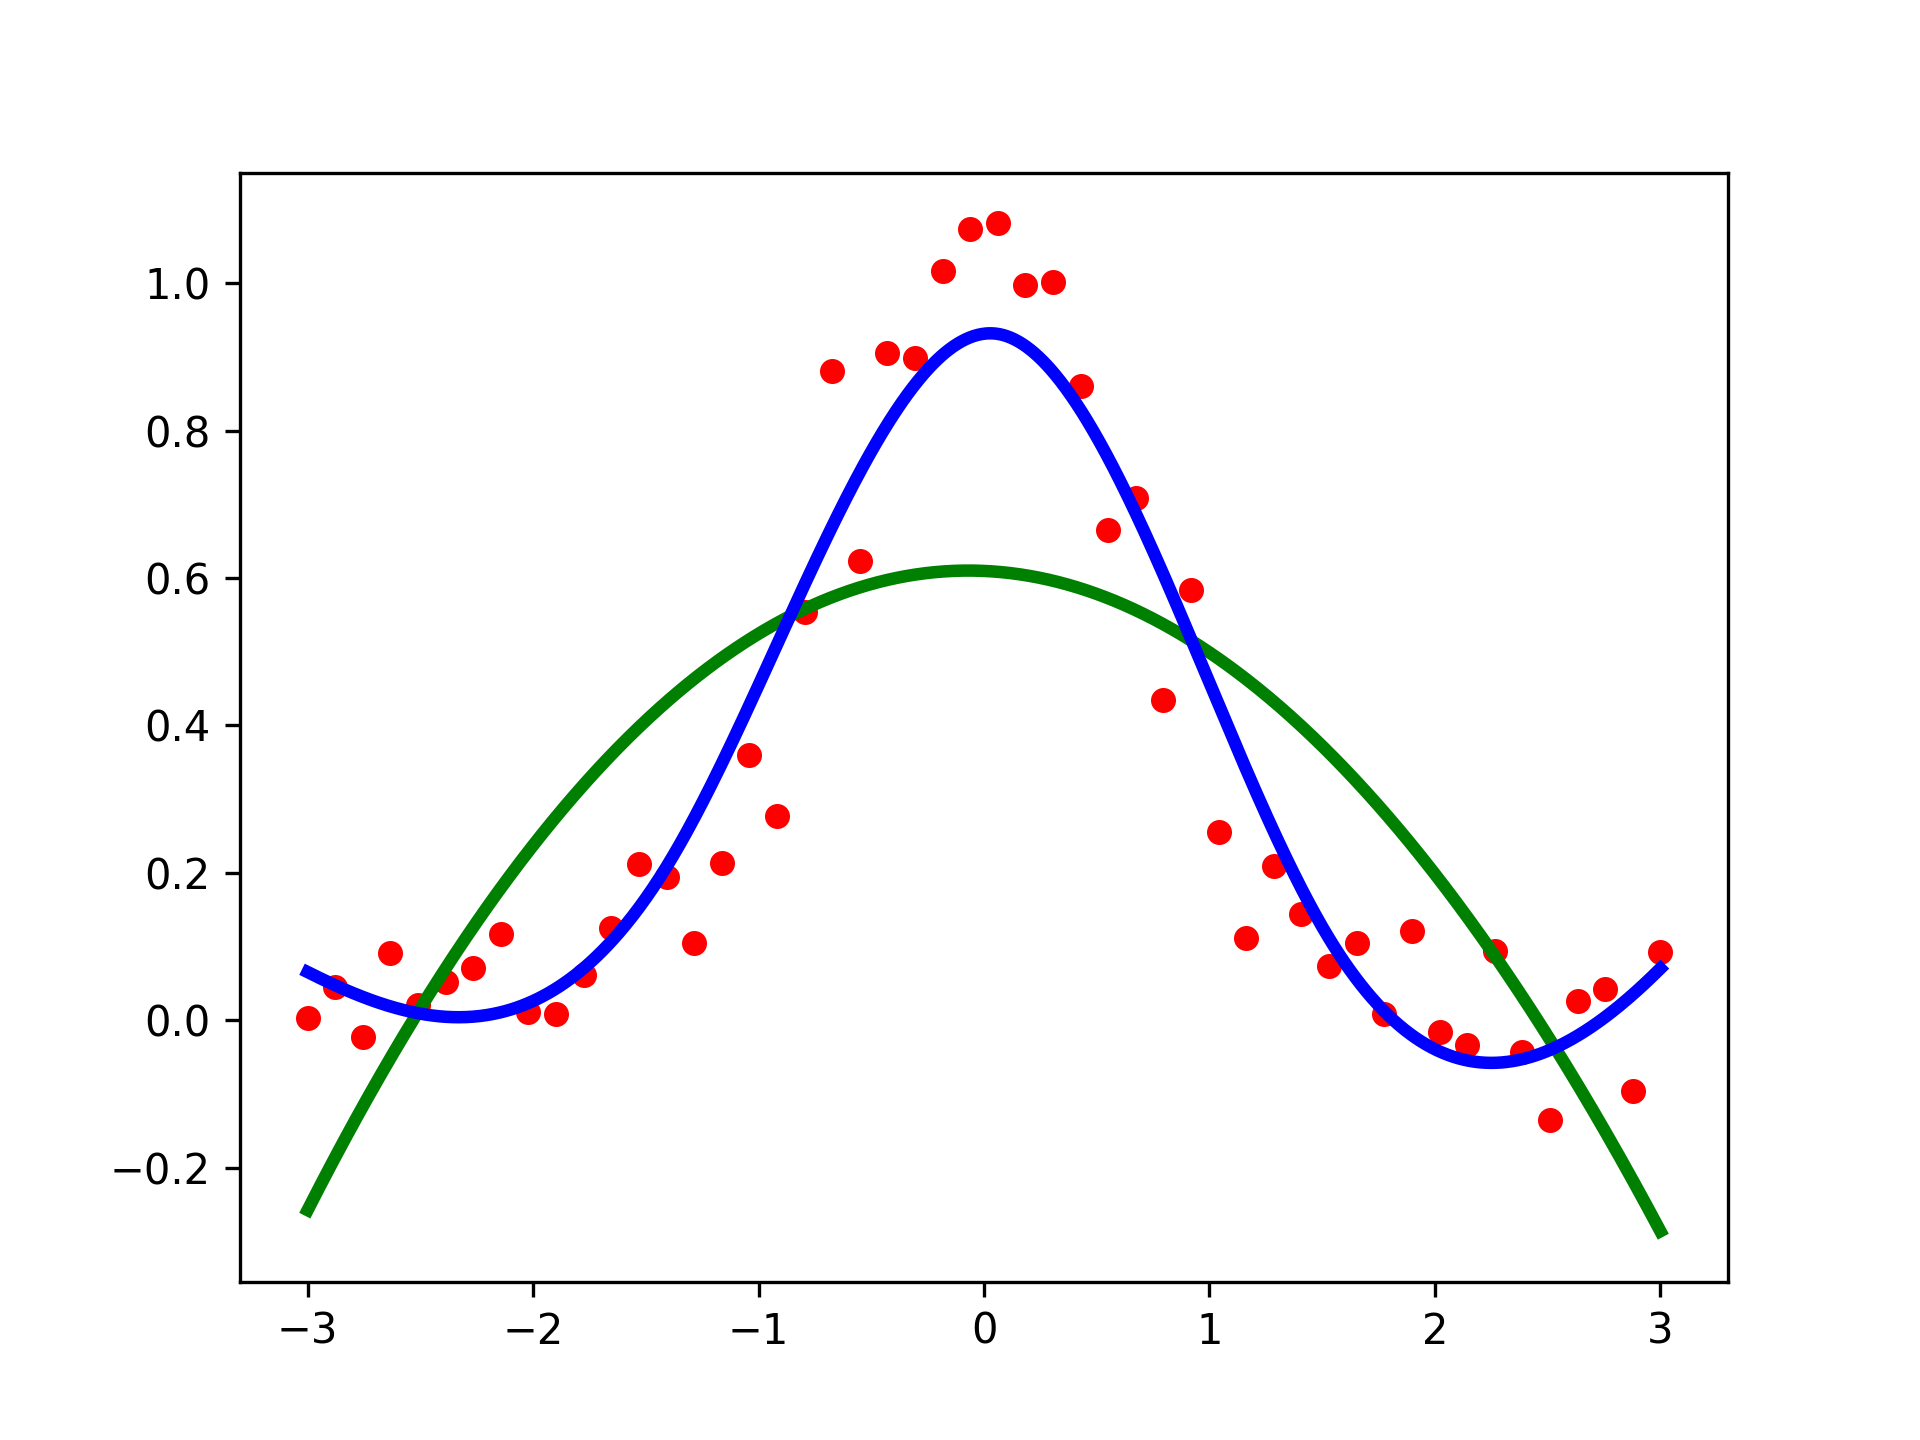
Examples
import numpy as np
import matplotlib.pyplot as plt
from scipy.interpolate import UnivariateSpline
rng = np.random.default_rng()
x = np.linspace(-3, 3, 50)
y = np.exp(-x**2) + 0.1 * rng.standard_normal(50)
✓
plt.plot(x, y, 'ro', ms=5)
✗spl = UnivariateSpline(x, y) xs = np.linspace(-3, 3, 1000)✓
plt.plot(xs, spl(xs), 'g', lw=3)
✗spl.set_smoothing_factor(0.5)
✓plt.plot(xs, spl(xs), 'b', lw=3)
✗plt.show()
✓
See also
- BivariateSpline
a base class for bivariate splines.
- InterpolatedUnivariateSpline
a interpolating univariate spline for a given set of data points.
- LSQBivariateSpline
a bivariate spline using weighted least-squares fitting
- LSQSphereBivariateSpline
a bivariate spline in spherical coordinates using weighted least-squares fitting
- RectBivariateSpline
a bivariate spline over a rectangular mesh
- RectSphereBivariateSpline
a bivariate spline over a rectangular mesh on a sphere
- SmoothBivariateSpline
a smoothing bivariate spline through the given points
- SmoothSphereBivariateSpline
a smoothing bivariate spline in spherical coordinates
- bisplev
a function to evaluate a bivariate B-spline and its derivatives
- bisplrep
a function to find a bivariate B-spline representation of a surface
- spalde
a function to evaluate all derivatives of a B-spline
- splev
a function to evaluate a B-spline or its derivatives
- splint
a function to evaluate the definite integral of a B-spline between two given points
- splrep
a function to find the B-spline representation of a 1-D curve
- sproot
a function to find the roots of a cubic B-spline
Aliases
-
scipy.interpolate.UnivariateSpline