bundles / scipy latest / scipy / signal / _spectral_py / coherence
function
scipy.signal._spectral_py:coherence
source: build-install/usr/lib/python3.14/site-packages/scipy/signal/_spectral_py.py:1910
Signature
def coherence(x, y, fs = 1.0, window = hann_periodic, nperseg = None, noverlap = None, nfft = None, detrend = constant, axis = -1)Summary
Estimate the magnitude squared coherence estimate, Cxy, of discrete-time signals X and Y using Welch's method.
Extended Summary
Cxy = abs(Pxy)**2/(Pxx*Pyy), where Pxx and Pyy are power spectral density estimates of X and Y, and Pxy is the cross spectral density estimate of X and Y.
Parameters
x: array_likeTime series of measurement values
y: array_likeTime series of measurement values
fs: float, optionalSampling frequency of the
xandytime series. Defaults to 1.0.window: str or tuple or array_like, optionalDesired window to use. If
windowis a string or tuple, it is passed to get_window to generate the window values, which are DFT-even by default. See get_window for a list of windows and required parameters. Ifwindowis array_like it will be used directly as the window and its length must be nperseg. Defaults to a periodic Hann window.nperseg: int, optionalLength of each segment. Defaults to None, but if window is str or tuple, is set to 256, and if window is array_like, is set to the length of the window.
noverlap: int, optionalNumber of points to overlap between segments. If None,
noverlap = nperseg // 2. Defaults to None.nfft: int, optionalLength of the FFT used, if a zero padded FFT is desired. If None, the FFT length is
nperseg. Defaults to None.detrend: str or function or `False`, optionalSpecifies how to detrend each segment. If
detrendis a string, it is passed as the type argument to thedetrendfunction. If it is a function, it takes a segment and returns a detrended segment. Ifdetrendis False, no detrending is done. Defaults to 'constant'.axis: int, optionalAxis along which the coherence is computed for both inputs; the default is over the last axis (i.e.
axis=-1).
Returns
f: ndarrayArray of sample frequencies.
Cxy: ndarrayMagnitude squared coherence of x and y.
Notes
An appropriate amount of overlap will depend on the choice of window and on your requirements. For the default Hann window an overlap of 50% is a reasonable trade-off between accurately estimating the signal power, while not over counting any of the data. Narrower windows may require a larger overlap.
Examples
import numpy as np
from scipy import signal
import matplotlib.pyplot as plt
rng = np.random.default_rng()
✓
fs = 10e3
N = 1e5
amp = 20
freq = 1234.0
noise_power = 0.001 * fs / 2
time = np.arange(N) / fs
b, a = signal.butter(2, 0.25, 'low')
x = rng.normal(scale=np.sqrt(noise_power), size=time.shape)
y = signal.lfilter(b, a, x)
x += amp*np.sin(2*np.pi*freq*time)
y += rng.normal(scale=0.1*np.sqrt(noise_power), size=time.shape)
✓
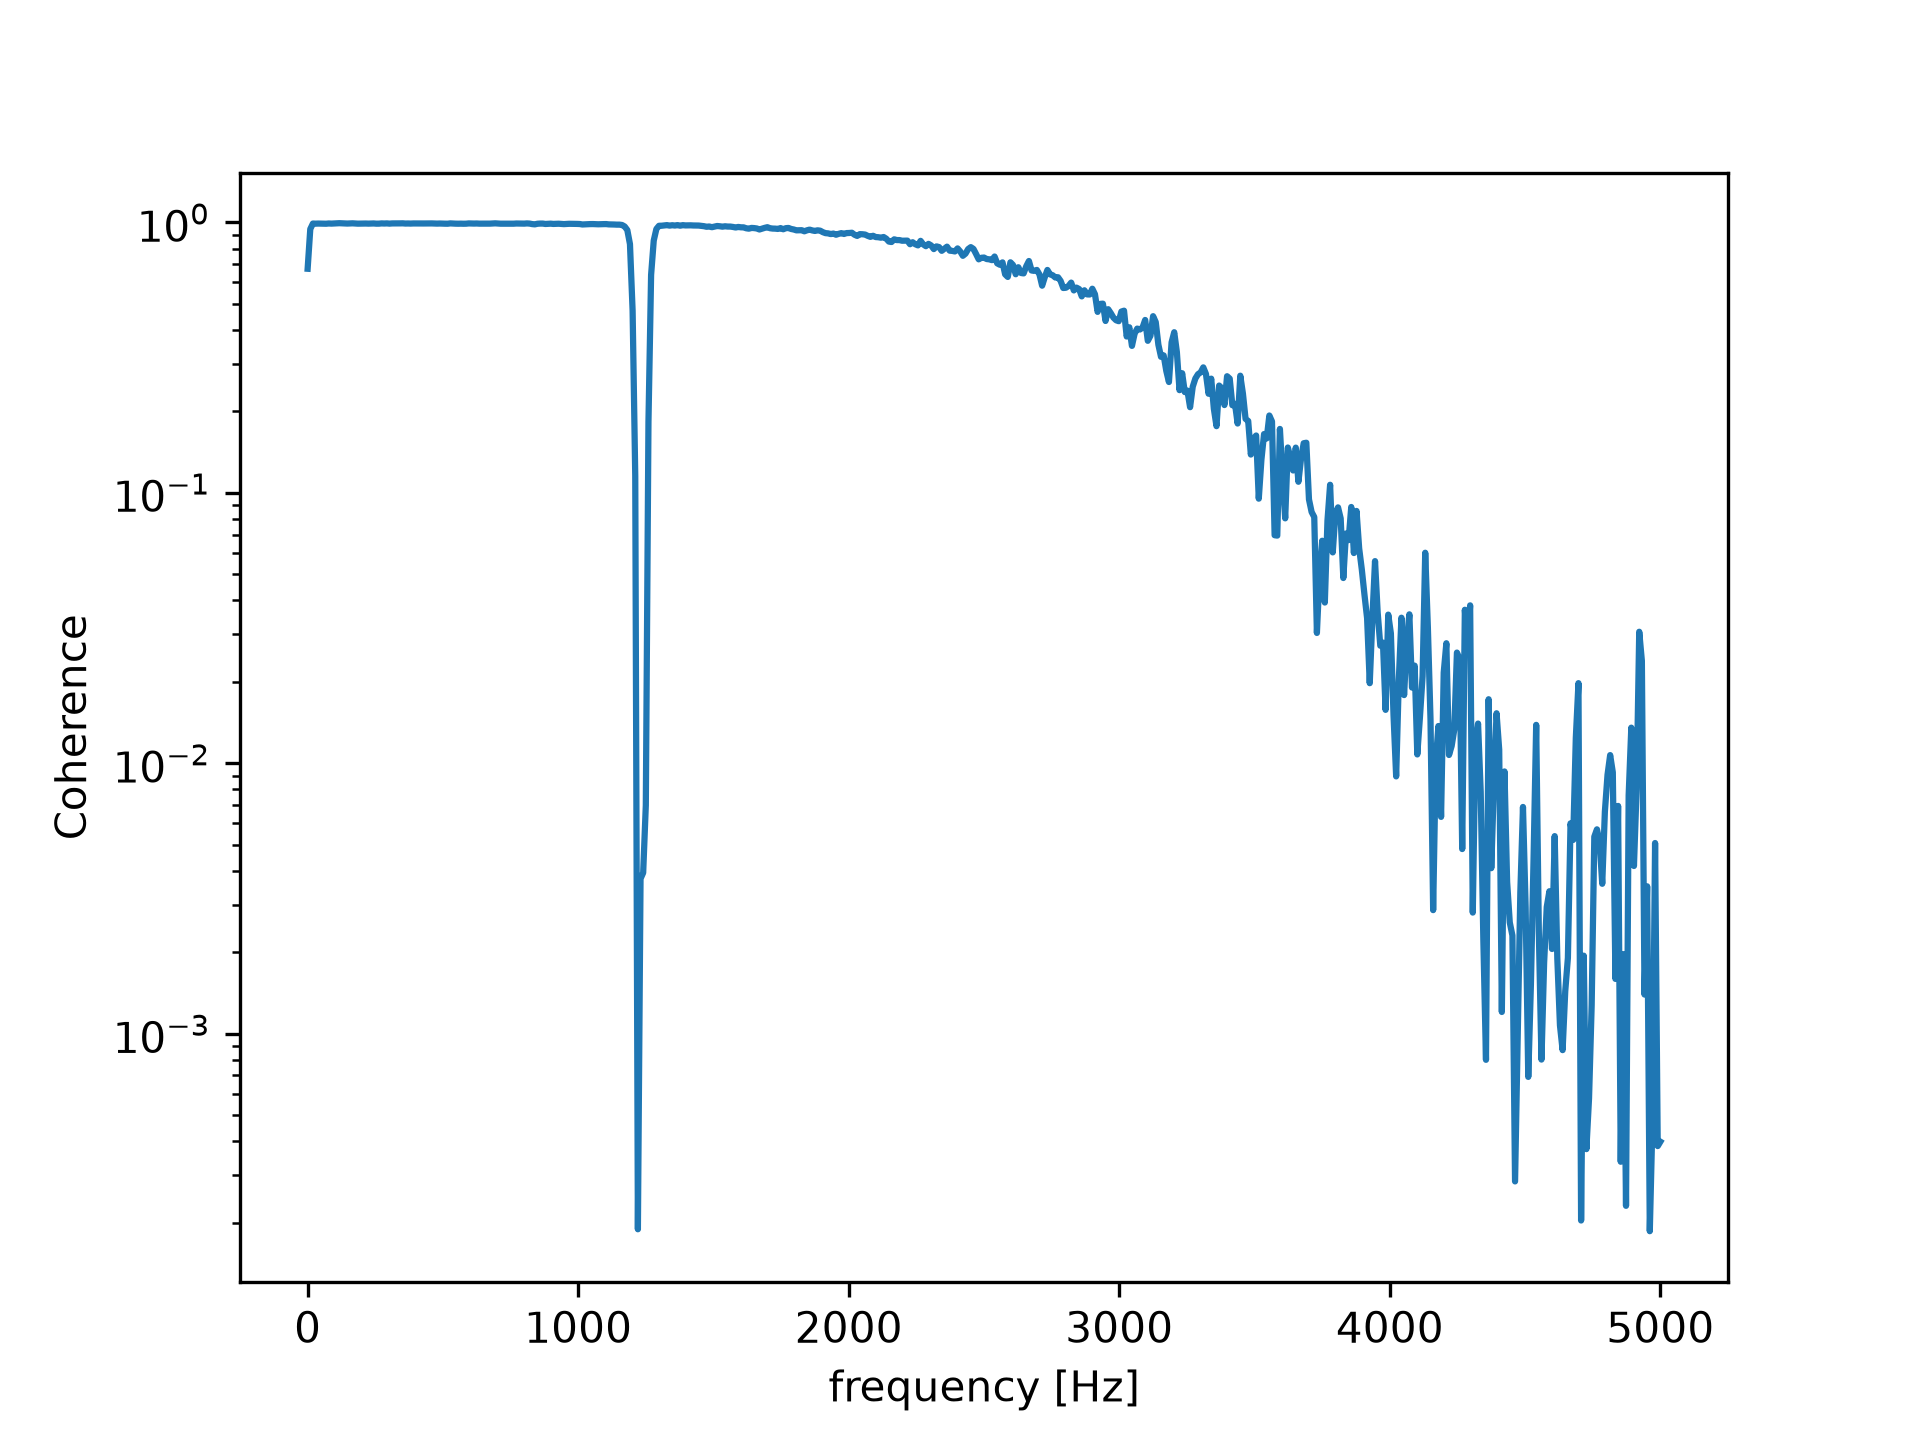
f, Cxy = signal.coherence(x, y, fs, nperseg=1024)
✓plt.semilogy(f, Cxy) plt.xlabel('frequency [Hz]') plt.ylabel('Coherence')✗
Text(0, 0.5, 'Coherence')
plt.show()
✓
See also
- csd
Cross spectral density by Welch's method.
- lombscargle
Lomb-Scargle periodogram for unevenly sampled data
- periodogram
Simple, optionally modified periodogram
- welch
Power spectral density by Welch's method.
Aliases
scipy.signal.coherence