bundles / numpy latest / numpy / random / _generator / Generator / exponential
cython_function_or_method
numpy.random._generator:Generator.exponential
Signature
def exponential ( scale = 1.0 , size = None ) Summary
Draw samples from an exponential distribution.
Extended Summary
Its probability density function is
for x > 0 and 0 elsewhere. is the scale parameter, which is the inverse of the rate parameter . The rate parameter is an alternative, widely used parameterization of the exponential distribution [3].
The exponential distribution is a continuous analogue of the geometric distribution. It describes many common situations, such as the size of raindrops measured over many rainstorms [1], or the time between page requests to Wikipedia [2].
Parameters
scale: float or array_like of floatsThe scale parameter, . Must be non-negative.
size: int or tuple of ints, optionalOutput shape. If the given shape is, e.g.,
(m, n, k), thenm * n * ksamples are drawn. If size isNone(default), a single value is returned ifscaleis a scalar. Otherwise,np.array(scale).sizesamples are drawn.
Returns
out: ndarray or scalarDrawn samples from the parameterized exponential distribution.
Examples
Assume a company has 10000 customer support agents and the time between customer calls is exponentially distributed and that the average time between customer calls is 4 minutes.scale, size = 4, 10000 rng = np.random.default_rng() time_between_calls = rng.exponential(scale=scale, size=size)✓
x = ((time_between_calls < 5).sum())/size
y = ((time_between_calls < 4).sum())/size
✓
x - y
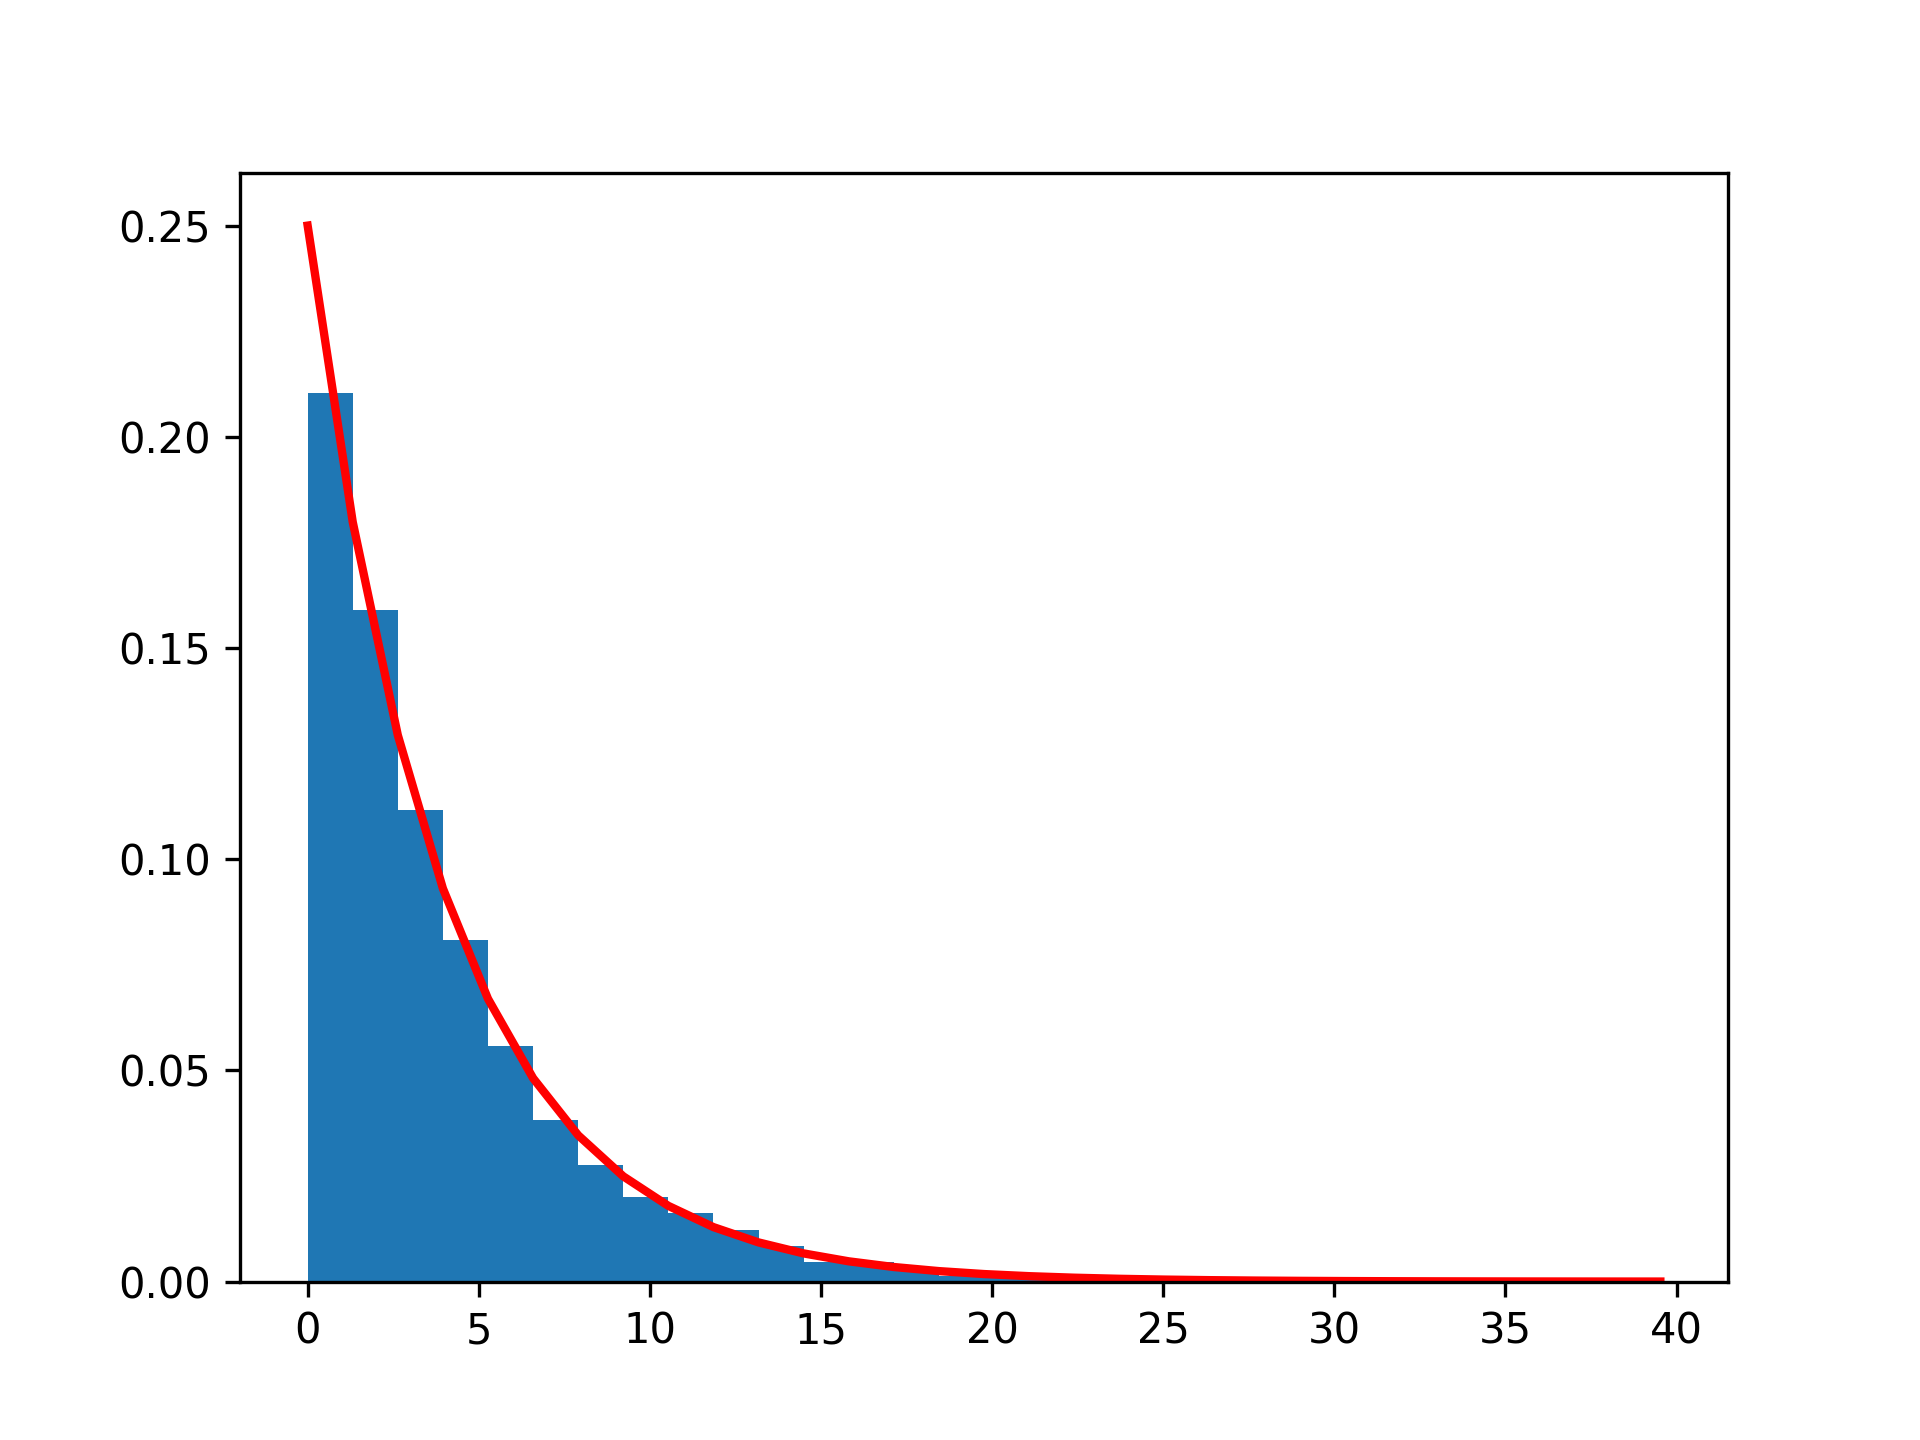
✗import matplotlib.pyplot as plt scale, size = 4, 10000 rng = np.random.default_rng() sample = rng.exponential(scale=scale, size=size) count, bins, _ = plt.hist(sample, 30, density=True)✓
plt.plot(bins, scale**(-1)*np.exp(-scale**-1*bins), linewidth=2, color='r')
✗plt.show()
✓
Aliases
-
numpy.random.Generator.exponential