bundles / numpy latest / numpy / random / _generator / Generator / weibull
cython_function_or_method
numpy.random._generator:Generator.weibull
Signature
def weibull ( a , size = None ) Summary
Draw samples from a Weibull distribution.
Extended Summary
Draw samples from a 1-parameter Weibull distribution with the given shape parameter a.
Here, U is drawn from the uniform distribution over (0,1].
The more common 2-parameter Weibull, including a scale parameter is just .
Parameters
a: float or array_like of floatsShape parameter of the distribution. Must be nonnegative.
size: int or tuple of ints, optionalOutput shape. If the given shape is, e.g.,
(m, n, k), thenm * n * ksamples are drawn. If size isNone(default), a single value is returned ifais a scalar. Otherwise,np.array(a).sizesamples are drawn.
Returns
out: ndarray or scalarDrawn samples from the parameterized Weibull distribution.
Notes
The Weibull (or Type III asymptotic extreme value distribution for smallest values, SEV Type III, or Rosin-Rammler distribution) is one of a class of Generalized Extreme Value (GEV) distributions used in modeling extreme value problems. This class includes the Gumbel and Frechet distributions.
The probability density for the Weibull distribution is
where is the shape and the scale.
The function has its peak (the mode) at .
When a = 1, the Weibull distribution reduces to the exponential distribution.
Examples
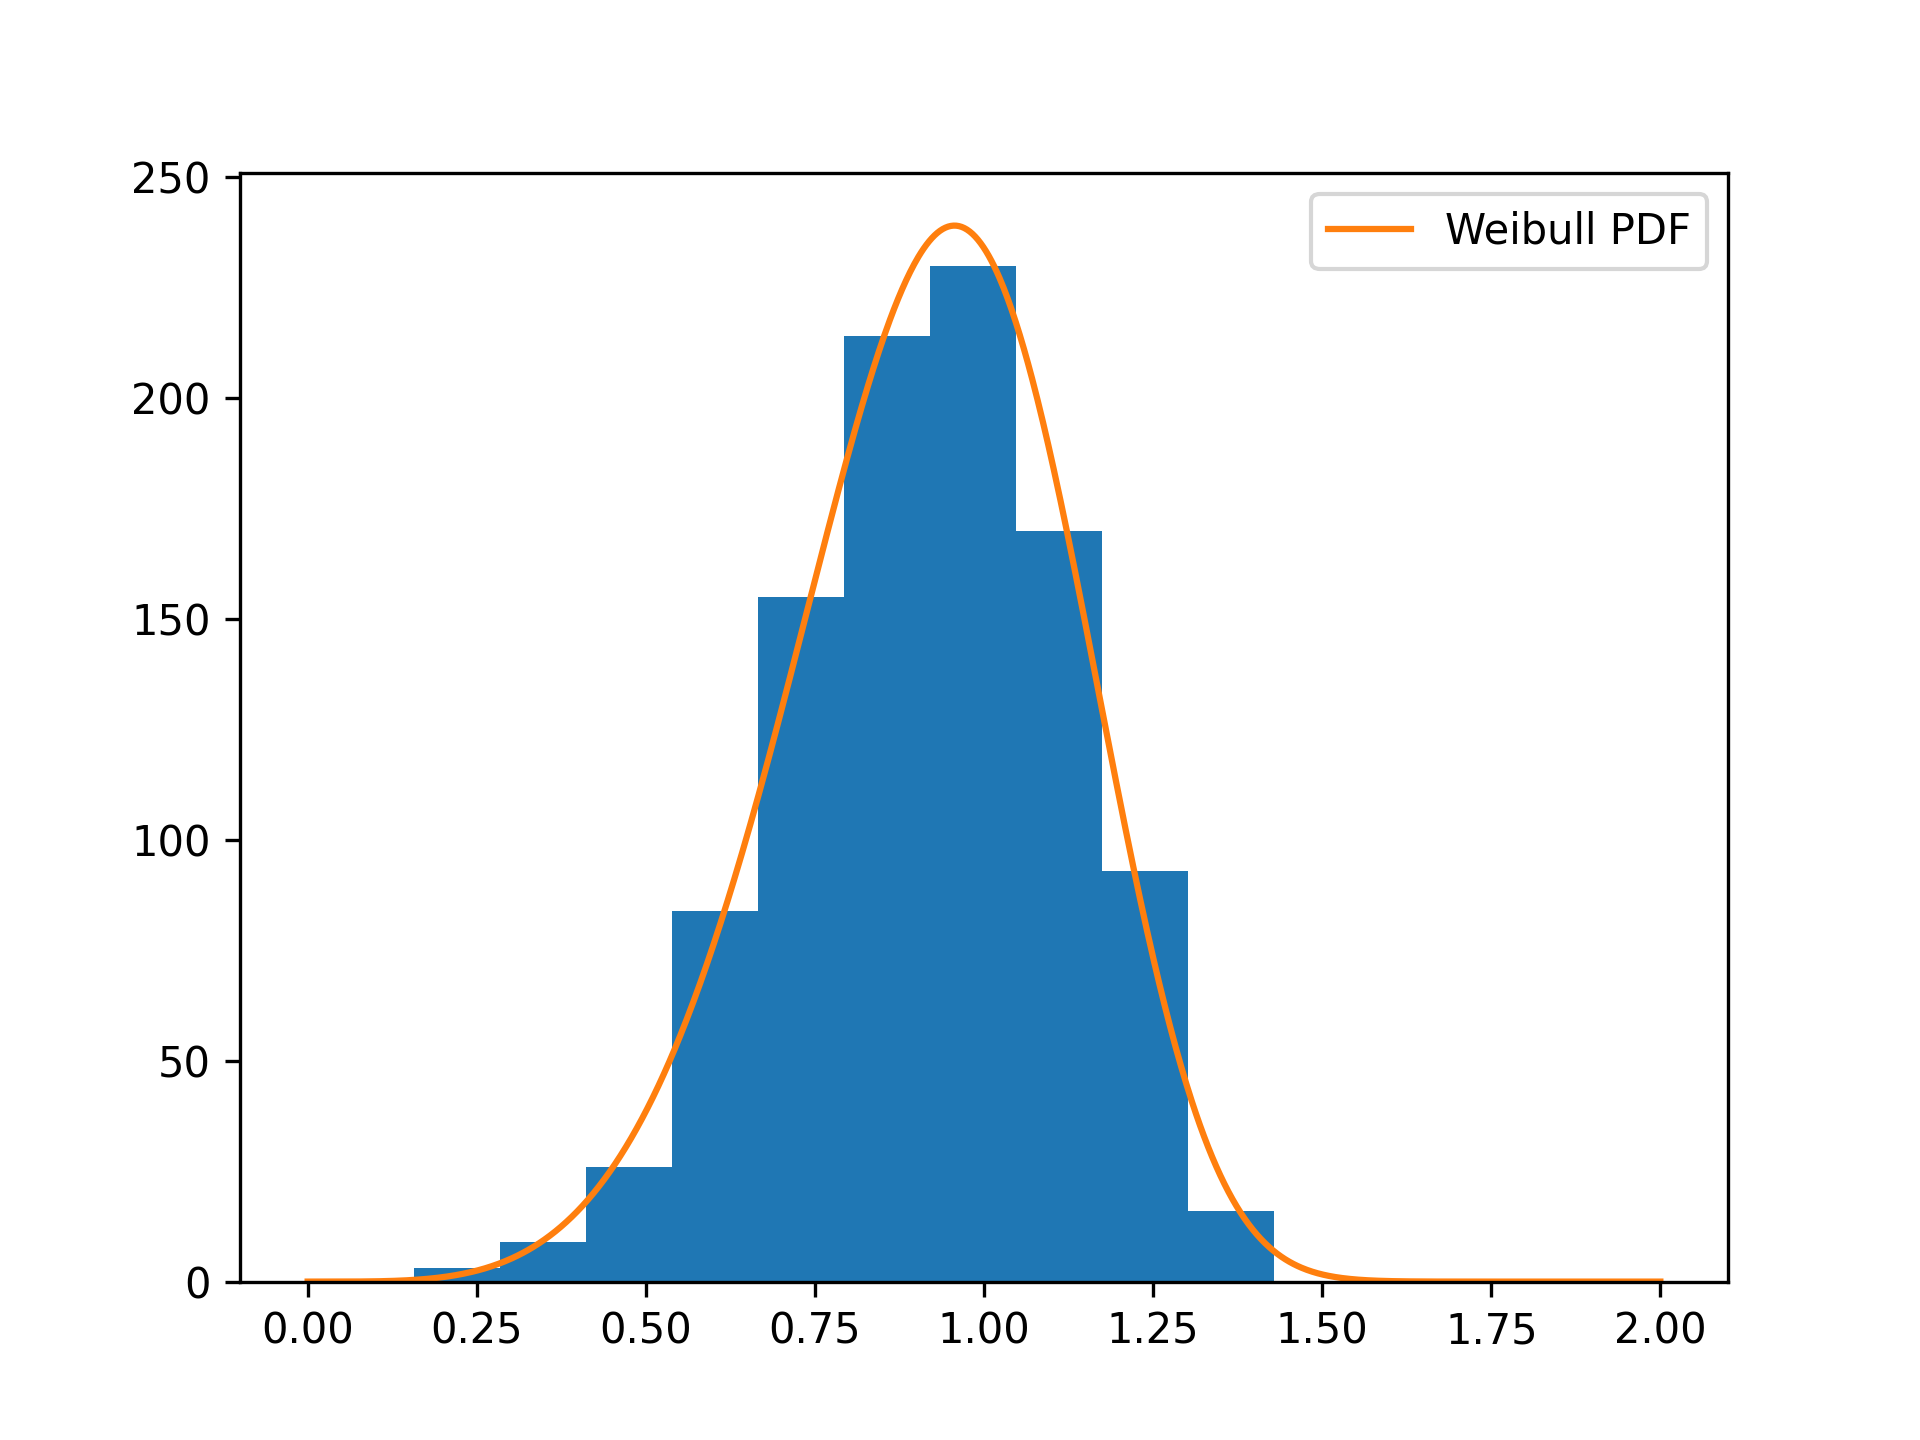
Draw samples from the distribution:rng = np.random.default_rng() a = 5. # shape s = rng.weibull(a, 1000)✓
import matplotlib.pyplot as plt
def weibull(x, n, a):
    return (a / n) * (x / n)**(a - 1) * np.exp(-(x / n)**a)
count, bins, _ = plt.hist(rng.weibull(5., 1000))
x = np.linspace(0, 2, 1000)
bin_spacing = np.mean(np.diff(bins))
✓
plt.plot(x, weibull(x, 1., 5.) * bin_spacing * s.size, label='Weibull PDF')
plt.legend()
✗
plt.show()
✓
See also
- gumbel
- scipy.stats.genextreme
- scipy.stats.weibull_max
- scipy.stats.weibull_min
Aliases
-
numpy.random.Generator.weibull