bundles / numpy latest / numpy / random / _generator / Generator / logseries
cython_function_or_method
numpy.random._generator:Generator.logseries
Signature
def logseries ( p , size = None ) Summary
Draw samples from a logarithmic series distribution.
Extended Summary
Samples are drawn from a log series distribution with specified shape parameter, 0 <= p < 1.
Parameters
p: float or array_like of floatsShape parameter for the distribution. Must be in the range [0, 1).
size: int or tuple of ints, optionalOutput shape. If the given shape is, e.g.,
(m, n, k), thenm * n * ksamples are drawn. If size isNone(default), a single value is returned ifpis a scalar. Otherwise,np.array(p).sizesamples are drawn.
Returns
out: ndarray or scalarDrawn samples from the parameterized logarithmic series distribution.
Notes
The probability mass function for the Log Series distribution is
where p = probability.
The log series distribution is frequently used to represent species richness and occurrence, first proposed by Fisher, Corbet, and Williams in 1943 [2]. It may also be used to model the numbers of occupants seen in cars [3].
Examples
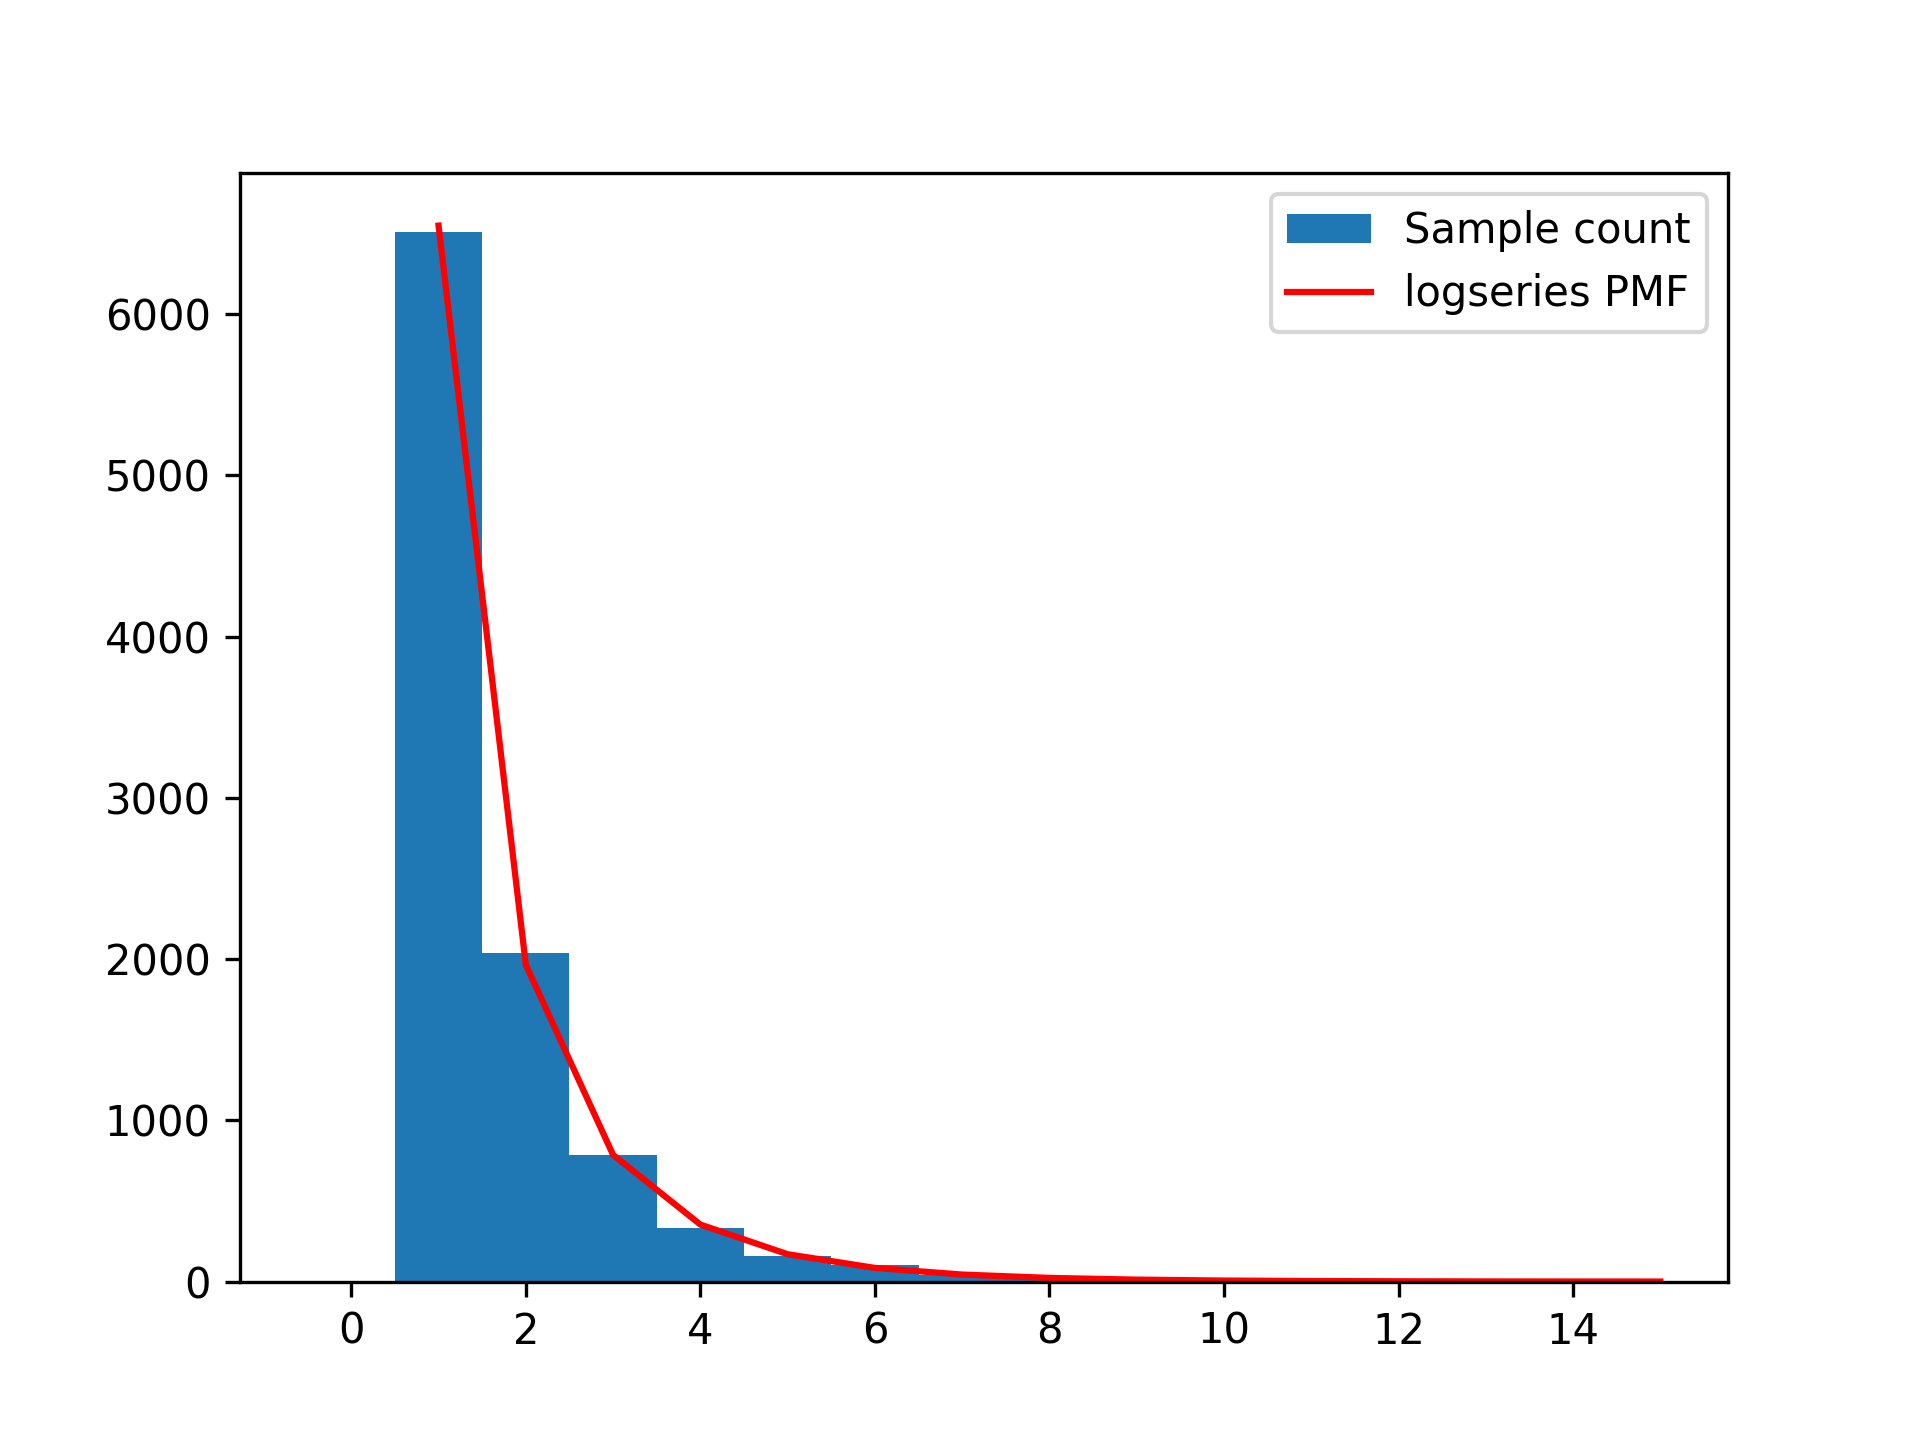
Draw samples from the distribution:a = .6 rng = np.random.default_rng() s = rng.logseries(a, 10000) import matplotlib.pyplot as plt bins = np.arange(-.5, max(s) + .5 ) count, bins, _ = plt.hist(s, bins=bins, label='Sample count')✓
def logseries(k, p):
    return -p**k/(k*np.log(1-p))
centres = np.arange(1, max(s) + 1)
✓
plt.plot(centres, logseries(centres, a) * s.size, 'r', label='logseries PMF')
plt.legend()
✗
plt.show()
✓
See also
- scipy.stats.logser
probability density function, distribution or cumulative density function, etc.
Aliases
-
numpy.random.Generator.logseries