bundles / numpy 2.4.4 / numpy / random / RandomState / lognormal
cython_function_or_method
numpy.random:RandomState.lognormal
Signature
def lognormal ( mean = 0.0 , sigma = 1.0 , size = None ) Summary
Draw samples from a log-normal distribution.
Extended Summary
Draw samples from a log-normal distribution with specified mean, standard deviation, and array shape. Note that the mean and standard deviation are not the values for the distribution itself, but of the underlying normal distribution it is derived from.
Parameters
mean: float or array_like of floats, optionalMean value of the underlying normal distribution. Default is 0.
sigma: float or array_like of floats, optionalStandard deviation of the underlying normal distribution. Must be non-negative. Default is 1.
size: int or tuple of ints, optionalOutput shape. If the given shape is, e.g.,
(m, n, k), thenm * n * ksamples are drawn. If size isNone(default), a single value is returned ifmeanandsigmaare both scalars. Otherwise,np.broadcast(mean, sigma).sizesamples are drawn.
Returns
out: ndarray or scalarDrawn samples from the parameterized log-normal distribution.
Notes
A variable x has a log-normal distribution if log(x) is normally distributed. The probability density function for the log-normal distribution is:
where is the mean and is the standard deviation of the normally distributed logarithm of the variable. A log-normal distribution results if a random variable is the product of a large number of independent, identically-distributed variables in the same way that a normal distribution results if the variable is the sum of a large number of independent, identically-distributed variables.
Examples
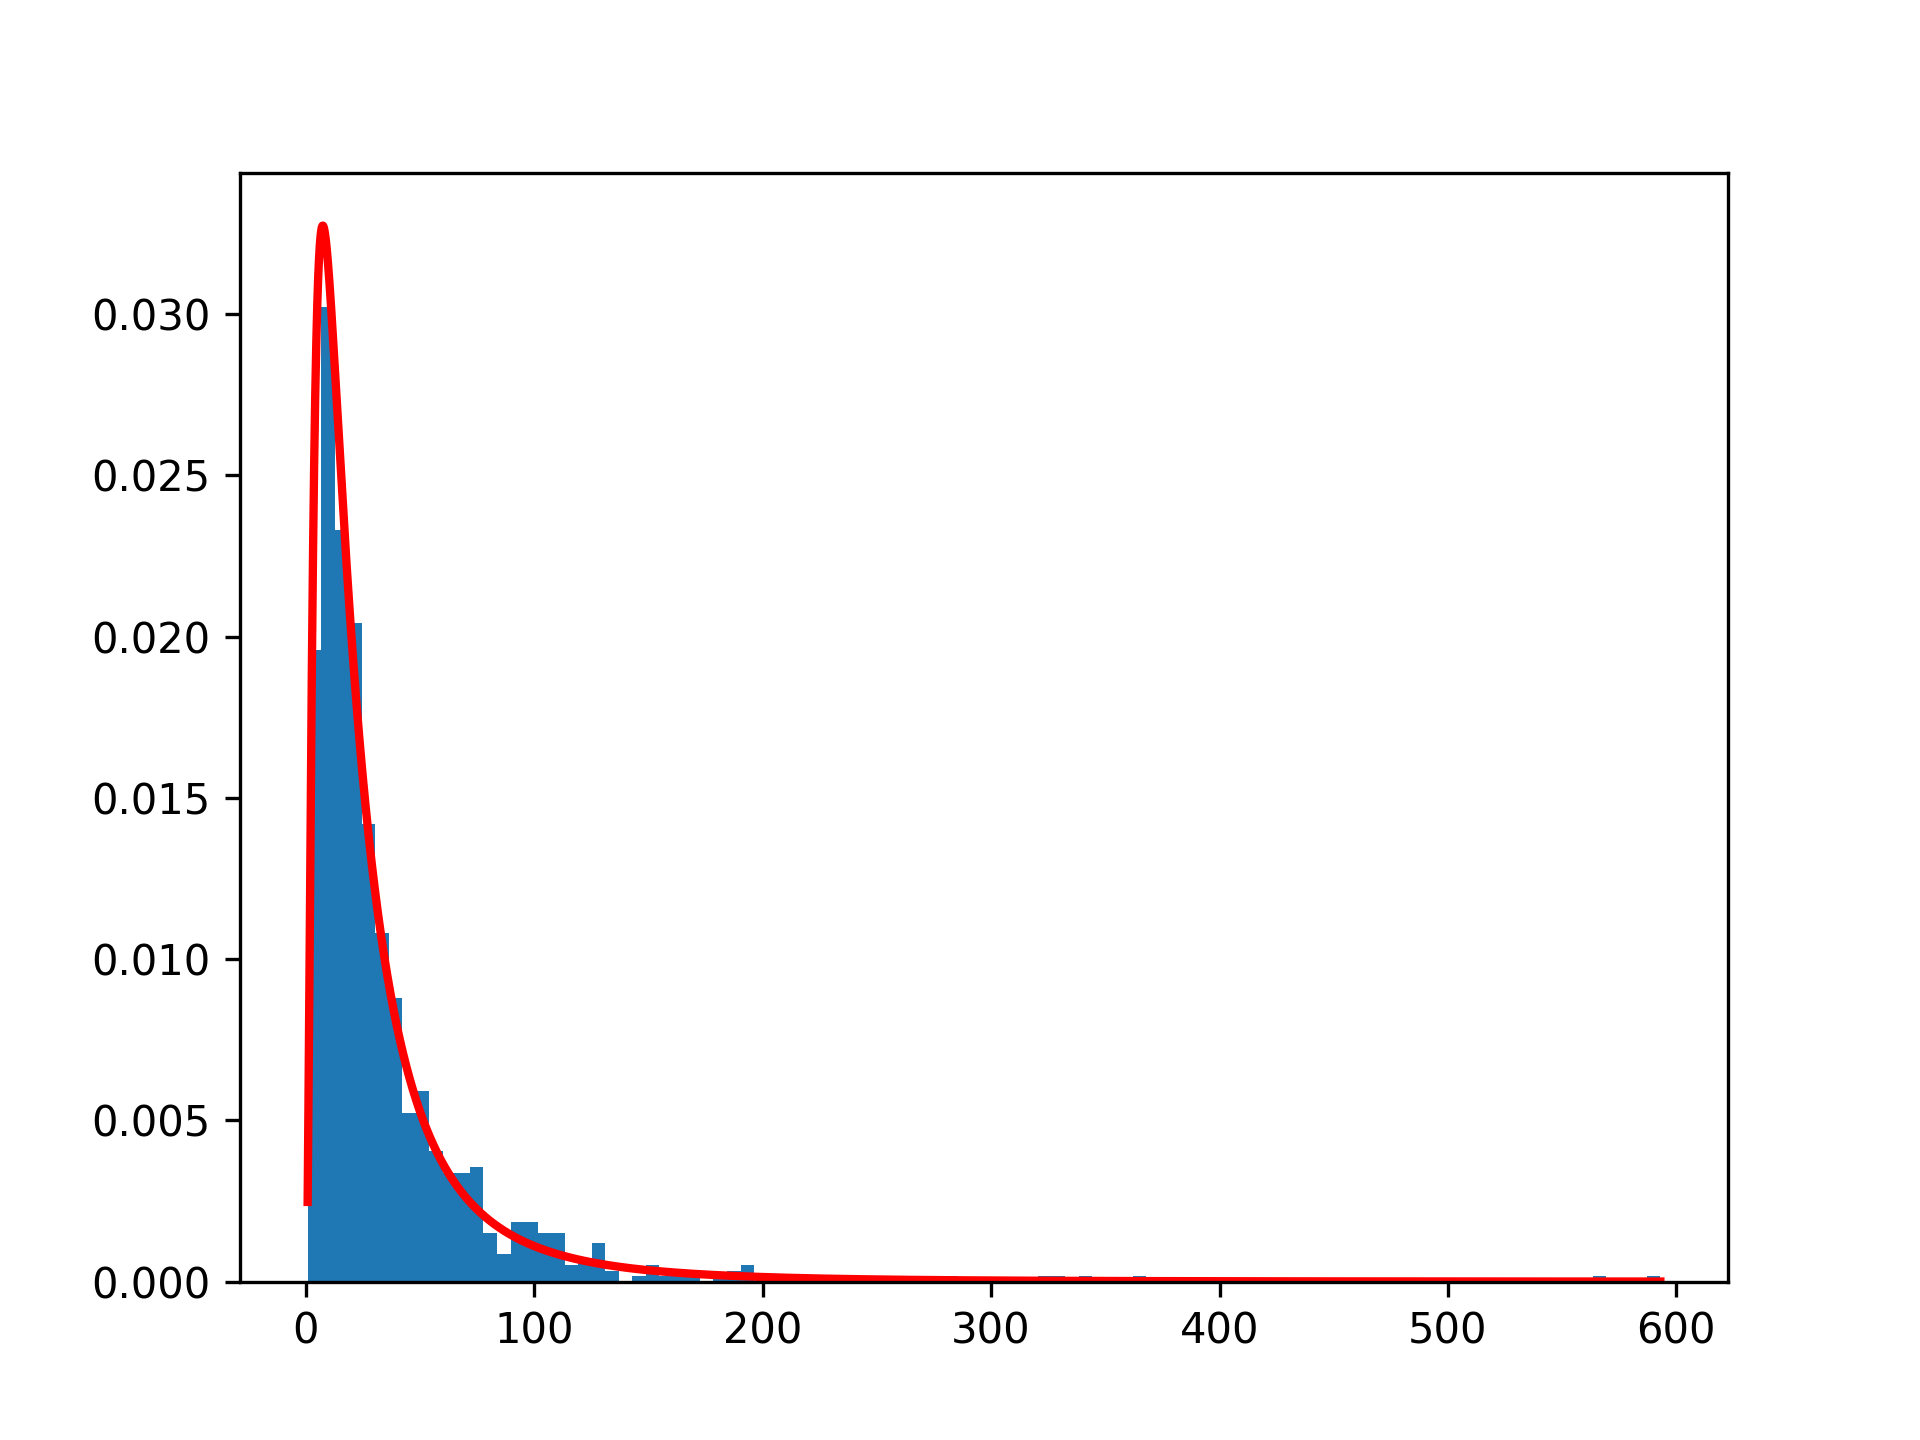
Draw samples from the distribution:mu, sigma = 3., 1. # mean and standard deviation s = np.random.lognormal(mu, sigma, 1000)✓
import matplotlib.pyplot as plt
count, bins, ignored = plt.hist(s, 100, density=True, align='mid')
✓
x = np.linspace(min(bins), max(bins), 10000)
pdf = (np.exp(-(np.log(x) - mu)**2 / (2 * sigma**2))
       / (x * sigma * np.sqrt(2 * np.pi)))
✓
plt.plot(x, pdf, linewidth=2, color='r')
plt.axis('tight')
✗
plt.show()
✓
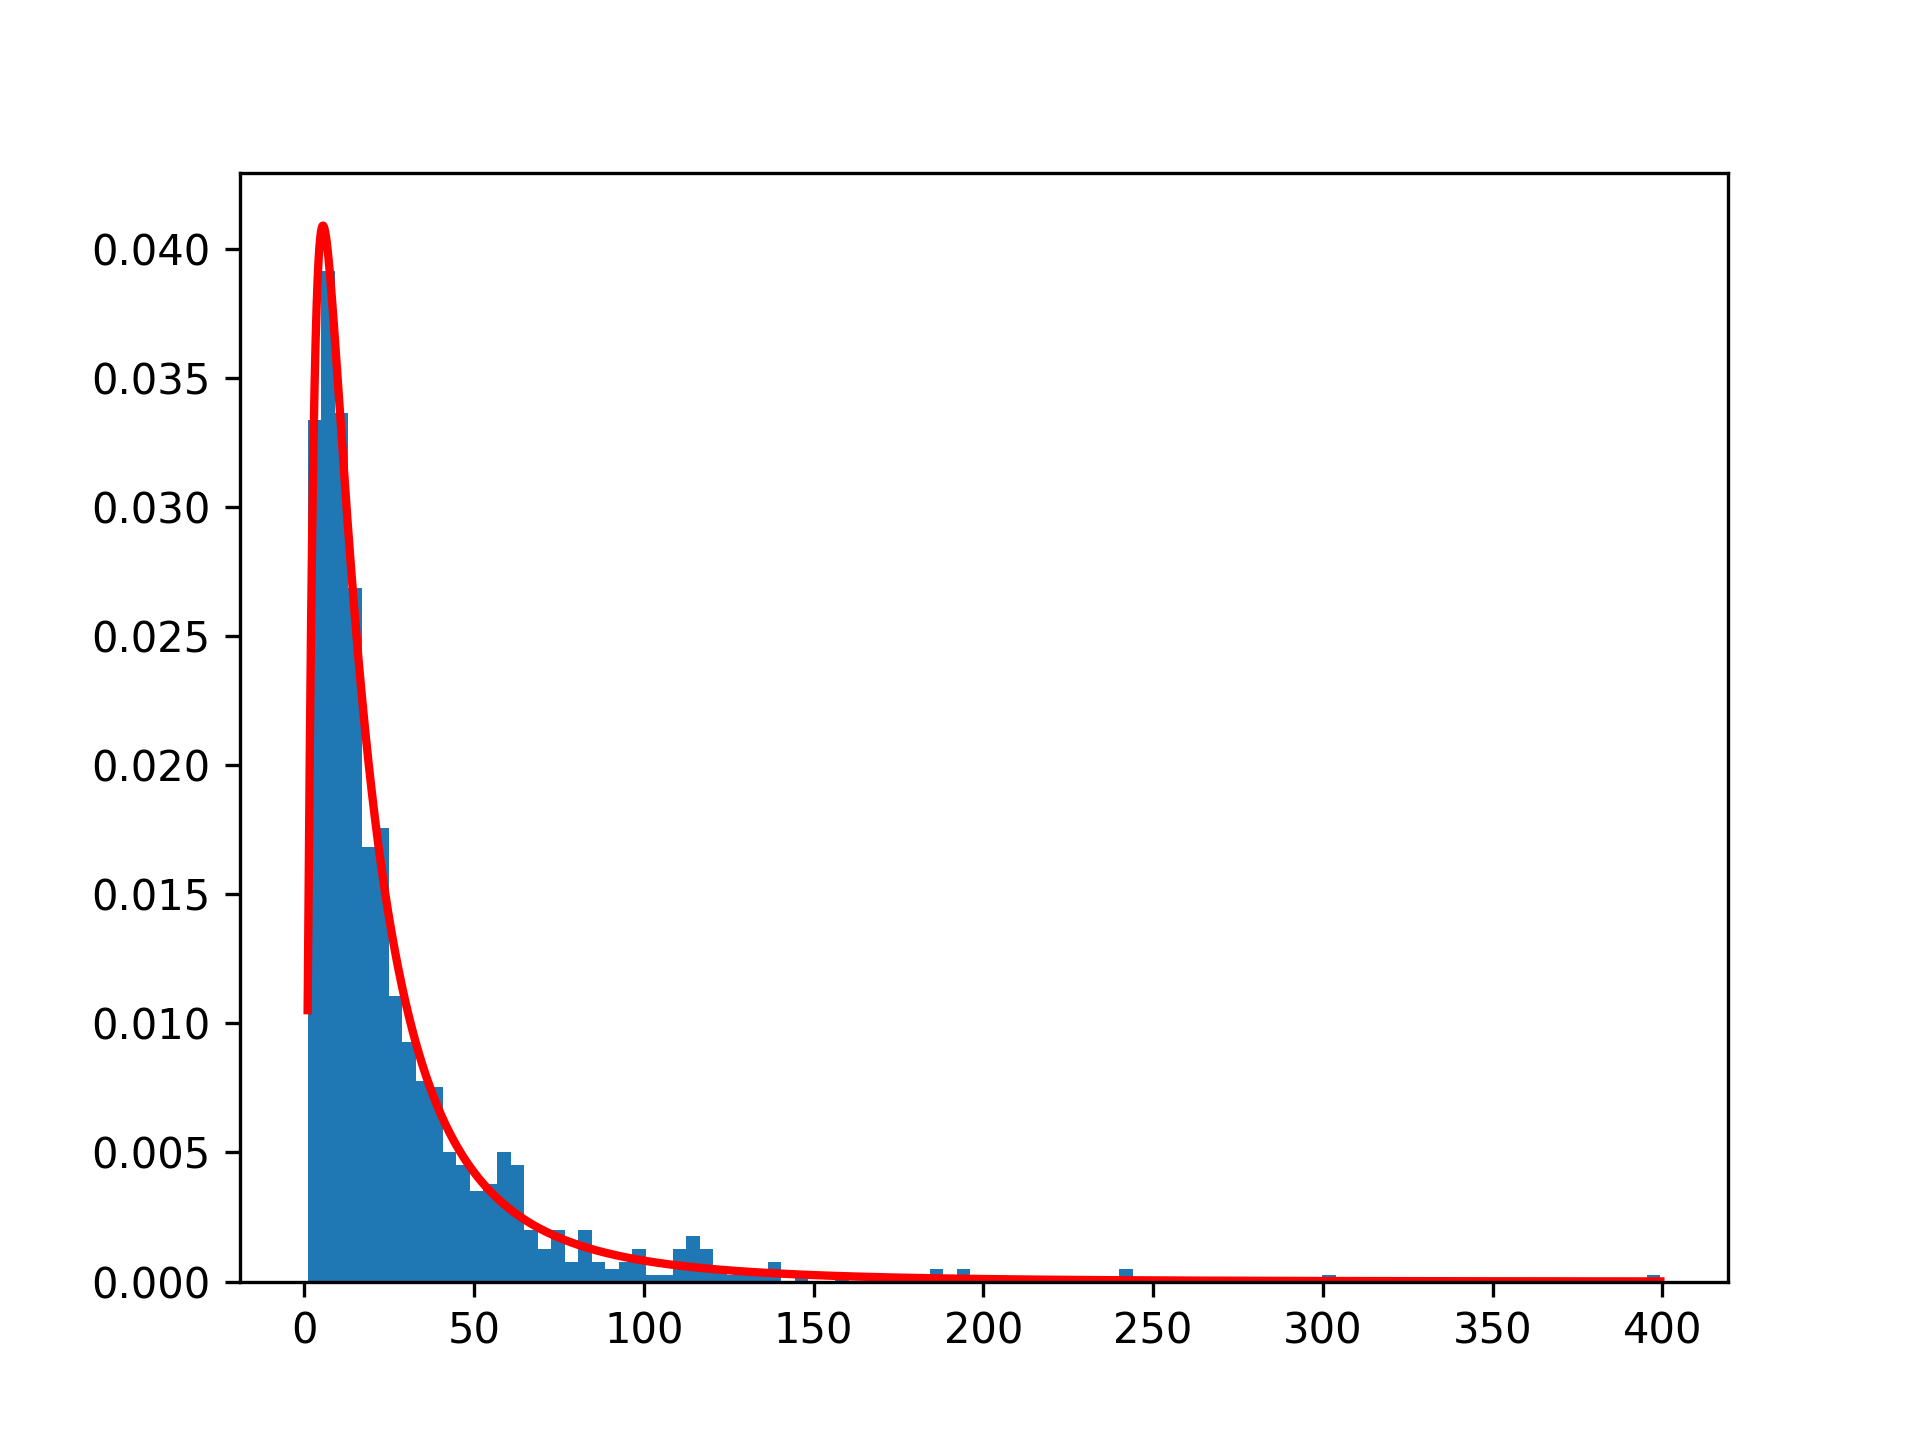
b = []
for i in range(1000):
   a = 10. + np.random.standard_normal(100)
   b.append(np.prod(a))
✓
b = np.array(b) / np.min(b) # scale values to be positive
count, bins, ignored = plt.hist(b, 100, density=True, align='mid')
sigma = np.std(np.log(b))
mu = np.mean(np.log(b))
✓
x = np.linspace(min(bins), max(bins), 10000)
pdf = (np.exp(-(np.log(x) - mu)**2 / (2 * sigma**2))
       / (x * sigma * np.sqrt(2 * np.pi)))
✓
plt.plot(x, pdf, color='r', linewidth=2)
✗plt.show()
✓
See also
- random.Generator.lognormal
which should be used for new code.
- scipy.stats.lognorm
probability density function, distribution, cumulative density function, etc.
Aliases
-
numpy.random.lognormal -
numpy.random.RandomState.lognormal