bundles / scipy latest / scipy / signal / _filter_design / cheb1ord
function
scipy.signal._filter_design:cheb1ord
source: build-install/usr/lib/python3.14/site-packages/scipy/signal/_filter_design.py:4394
Signature
def cheb1ord(wp, ws, gpass, gstop, analog = False, fs = None)Summary
Chebyshev type I filter order selection.
Extended Summary
Return the order of the lowest order digital or analog Chebyshev Type I filter that loses no more than gpass dB in the passband and has at least gstop dB attenuation in the stopband.
Parameters
wp, ws: floatPassband and stopband edge frequencies.
For digital filters, these are in the same units as
fs. By default,fsis 2 half-cycles/sample, so these are normalized from 0 to 1, where 1 is the Nyquist frequency. (wpandwsare thus in half-cycles / sample.) For example:Lowpass: wp = 0.2, ws = 0.3
Highpass: wp = 0.3, ws = 0.2
Bandpass: wp = [0.2, 0.5], ws = [0.1, 0.6]
Bandstop: wp = [0.1, 0.6], ws = [0.2, 0.5]
For analog filters,
wpandwsare angular frequencies (e.g., rad/s).gpass: floatThe maximum loss in the passband (dB).
gstop: floatThe minimum attenuation in the stopband (dB).
analog: bool, optionalWhen True, return an analog filter, otherwise a digital filter is returned.
fs: float, optionalThe sampling frequency of the digital system.
Returns
Examples
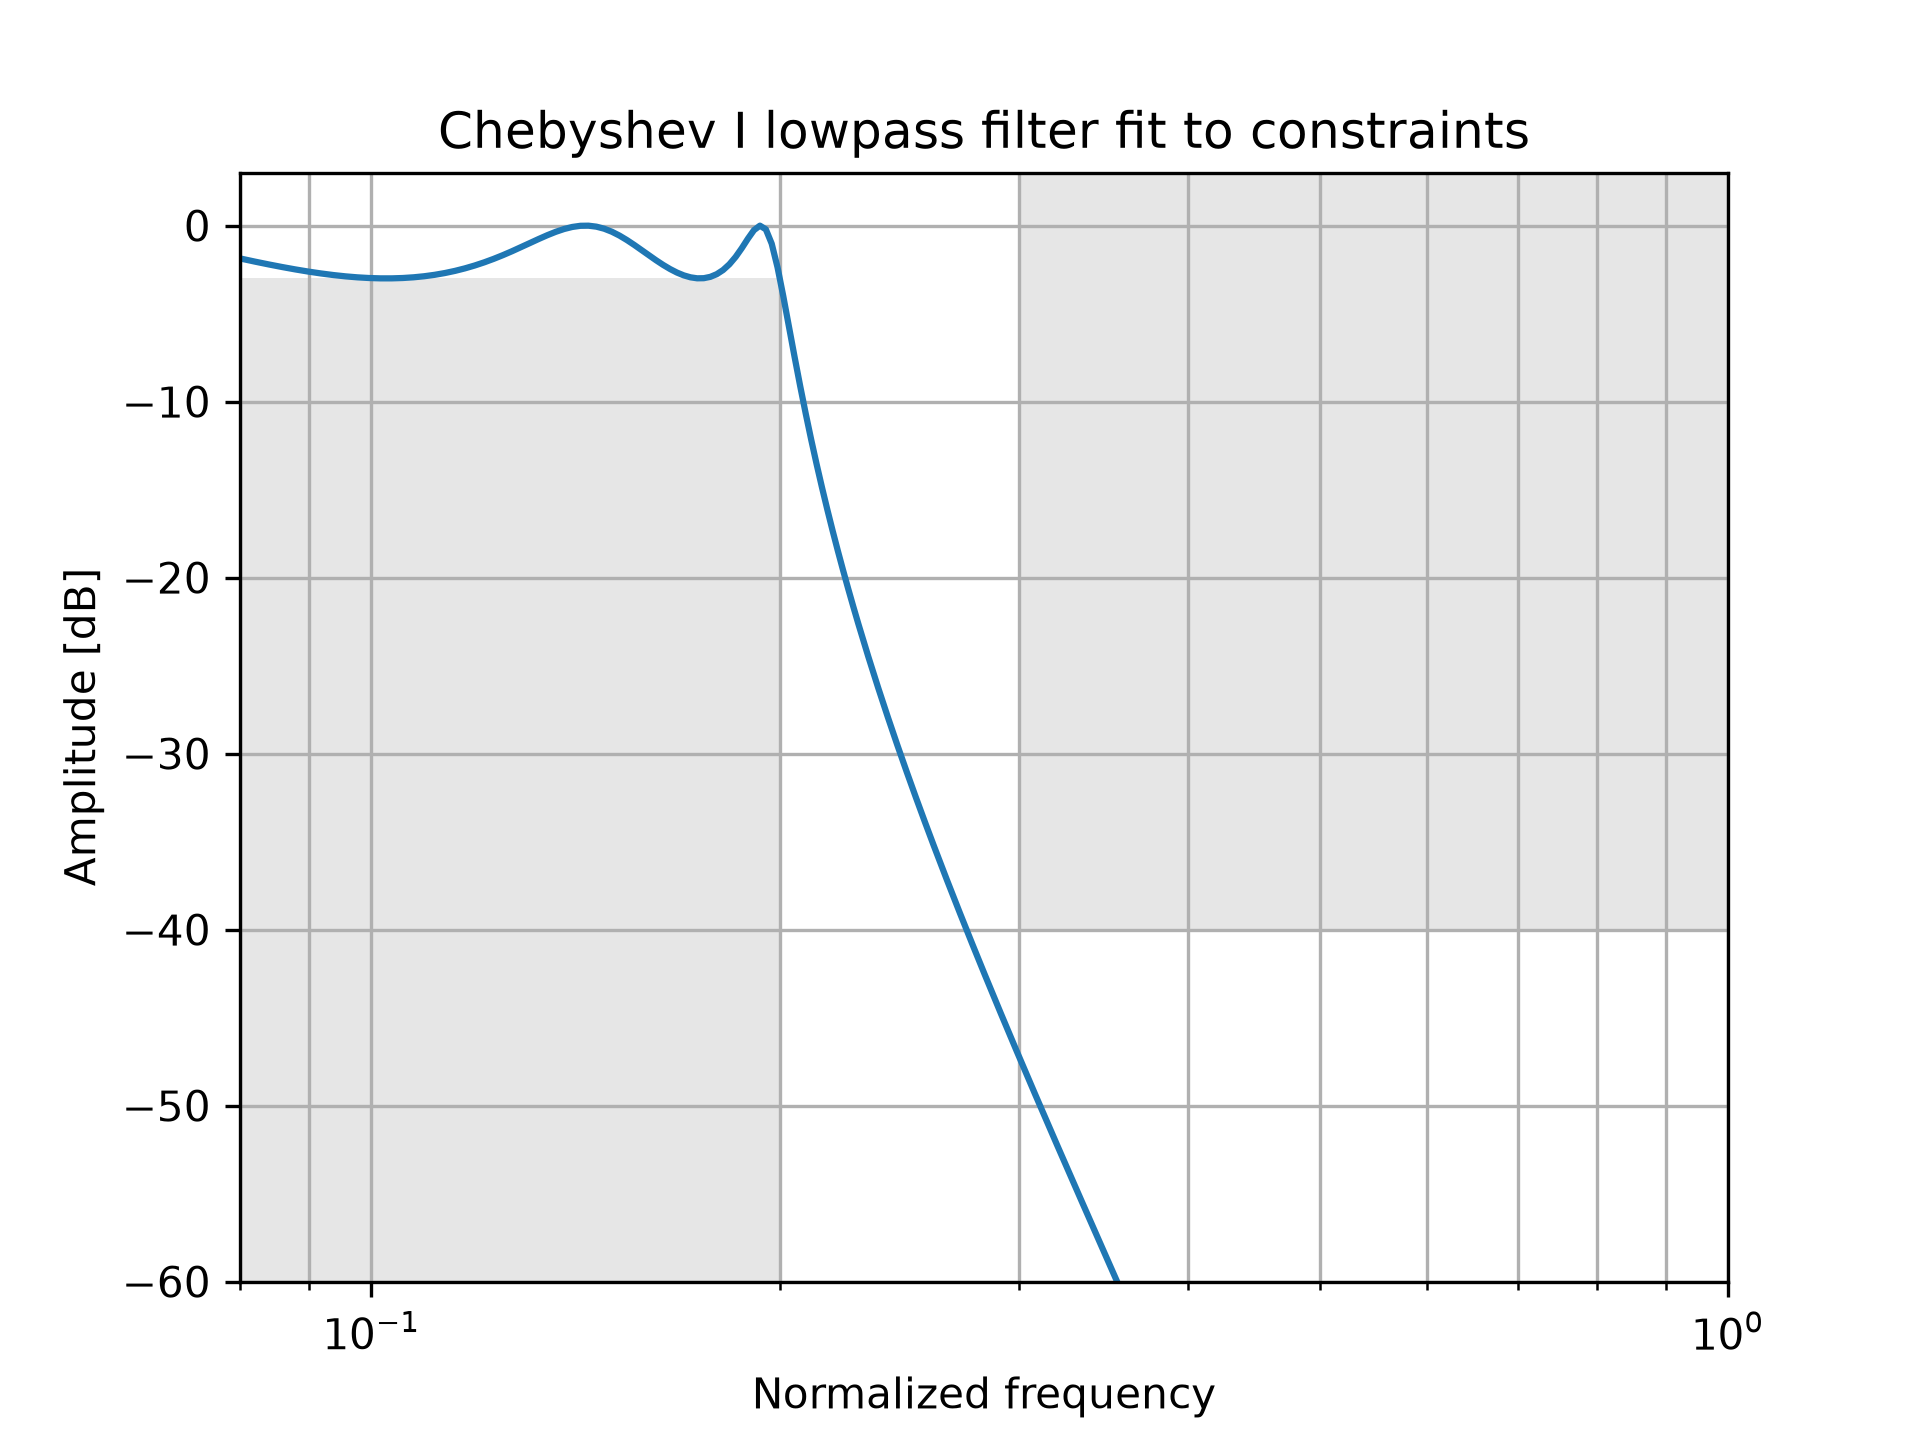
Design a digital lowpass filter such that the passband is within 3 dB up to 0.2*(fs/2), while rejecting at least -40 dB above 0.3*(fs/2). Plot its frequency response, showing the passband and stopband constraints in gray.from scipy import signal import matplotlib.pyplot as plt import numpy as np✓
N, Wn = signal.cheb1ord(0.2, 0.3, 3, 40)
b, a = signal.cheby1(N, 3, Wn, 'low')
w, h = signal.freqz(b, a)
✓
plt.semilogx(w / np.pi, 20 * np.log10(abs(h)))
plt.title('Chebyshev I lowpass filter fit to constraints')
plt.xlabel('Normalized frequency')
plt.ylabel('Amplitude [dB]')
✗
Text(0, 0.5, 'Amplitude [dB]')
plt.grid(which='both', axis='both')
✓plt.fill([.01, 0.2, 0.2, .01], [-3, -3, -99, -99], '0.9', lw=0) # stop plt.fill([0.3, 0.3, 2, 2], [ 9, -40, -40, 9], '0.9', lw=0) # pass plt.axis([0.08, 1, -60, 3])✗
(np.float64(0.08), np.float64(1.0), np.float64(-60.0), np.float64(3.0))
plt.show()
✓
See also
Aliases
scipy.signal.cheb1ord